
This mathematics problem involves applying core mathematical principles and formulas. Below you will find a complete step-by-step solution with detailed explanations for each step, helping you understand not just the answer but the method behind it.
ScanSolve AI Answer
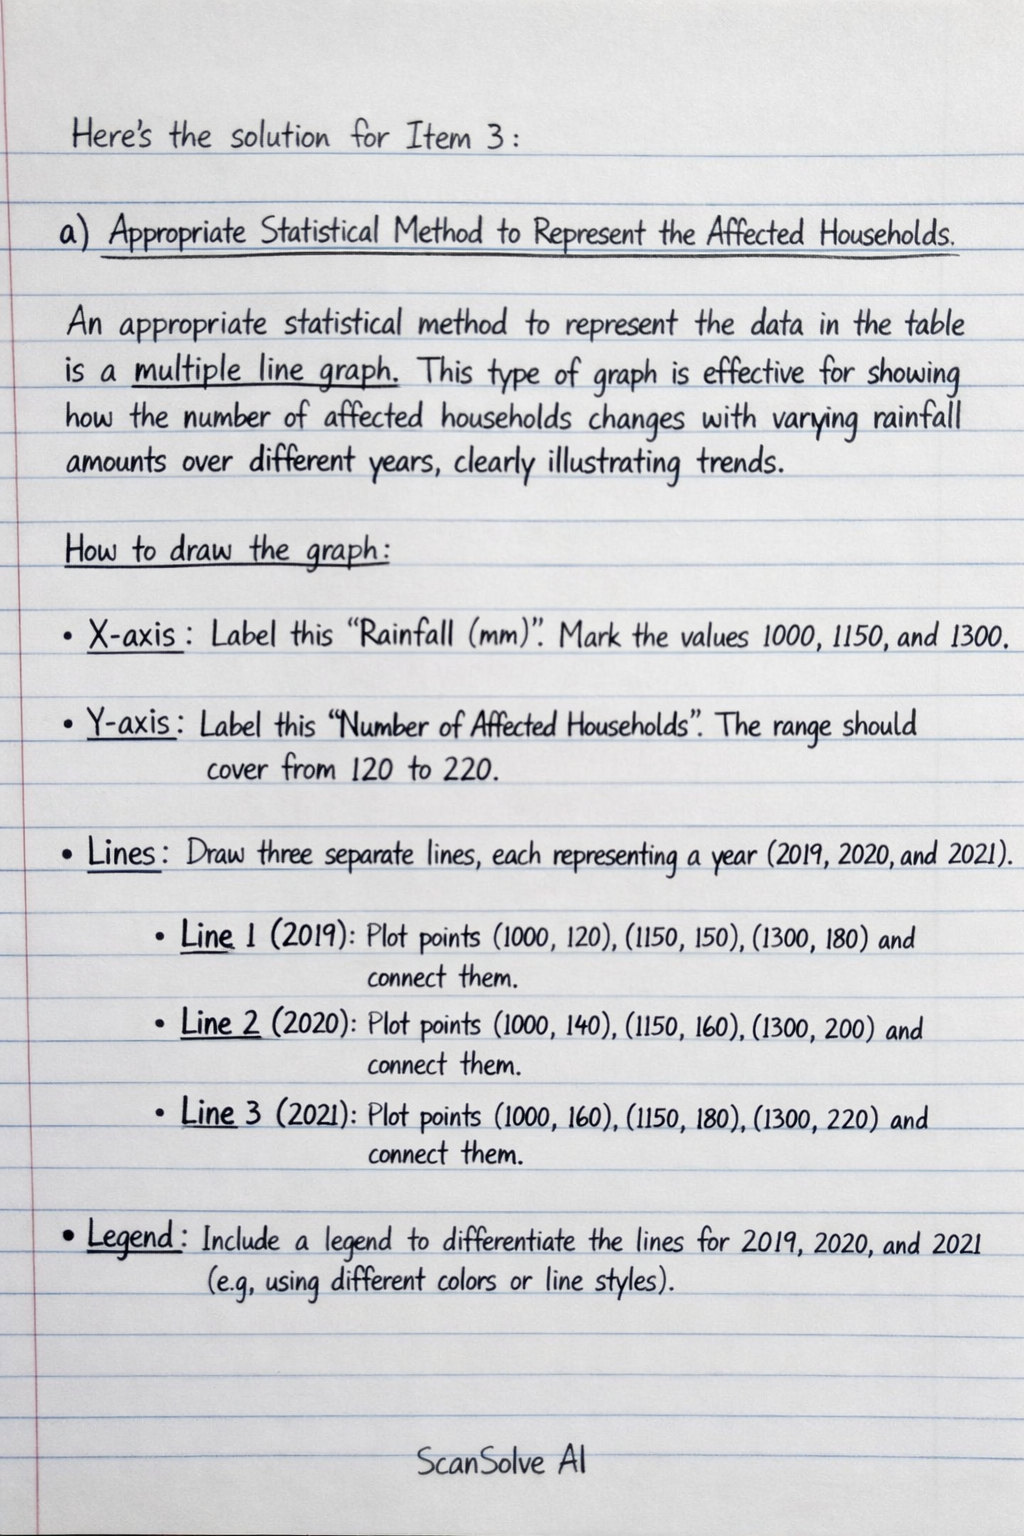
Here's the solution for Item 3: a) Appropriate Statistical Method to Represent the Affected Households An appropriate statistical method to represent the data in the table is a multiple line graph. This type of graph is effective for showing how the number of affected households changes with varying rainfall amounts over different years, clearly illustrating trends. How to draw the graph: X-axis: Label this "Rainfall (mm)". Mark the values 1000, 1150, and 1300. Y-axis: Label this "Number of Affected Households". The range should cover from 120 to 220. Lines: Draw three separate lines, each representing a year (2019, 2020, and 2021). Line 1 (2019): Plot points (1000, 120), (1150, 150), (1300, 180) and connect them. Line 2 (2020): Plot points (1000, 140), (1150, 160), (1300, 200) and connect them. Line 3 (2021): Plot points (1000, 160), (1150, 180), (1300, 220) and connect them. Legend: Include a legend to differentiate the lines for 2019, 2020, and 2021 (e.g., using different colors or line styles). Title: "Number of Affected Households by Rainfall and Year in Kisoro District". b) Report to the District Officials REPORT ON INCREASING HOUSEHOLD VULNERABILITY TO CALAMITIES IN KISORO DISTRICT To: District Officials, Kisoro District From: [Your School Name/Research Team] Date: October 26, 2023 Subject: Analysis of Trends in Household Calamities and Future Outlook 1. Introduction Kisoro District, characterized by steep hills, has experienced a concerning increase in soil movement incidents, particularly during rainy seasons, over the past five years. This report presents an analysis of data relating rainfall amounts to the number of affected households between 2019 and 2021, highlighting critical areas of concern and potential future outcomes if current trends persist. 2. Analysis of Trends The data clearly indicates a worrying trend: Increasing Vulnerability Over Time: For any given rainfall amount, the number of affected households has consistently increased year-on-year. For example, at 1000mm of rainfall, affected households rose from 120 in 2019 to 160 in 2021. Similarly, at 1300mm, the number increased from 180 to 220 over the same period. This suggests a growing susceptibility of the population to calamities, likely due to factors such as land use changes and environmental degradation. Direct Correlation with Rainfall: Within each year, an increase in rainfall directly correlates with a higher number of affected households. This confirms that heavy rainfall is a primary trigger for these incidents. 3. Areas of Concern Based on these trends and the district's context, the following are critical areas of concern: Escalating Risk to Lives and Livelihoods: The continuous increase in affected households implies a heightened risk of fatalities, injuries, displacement, and loss of property and agricultural land for the district's residents. Environmental Degradation: Changes in land use on steep slopes, coupled with intense rainfall, are likely accelerating soil erosion and land instability, creating a vicious cycle of environmental degradation and increased disaster risk. Strain on District Resources: The rising number of incidents will place an increasing burden on district resources for emergency response, relief efforts, rehabilitation, and long-term recovery, potentially diverting funds from other development initiatives. Food Insecurity: Destruction of crops and agricultural land due to soil movement incidents will exacerbate food insecurity, particularly for vulnerable communities dependent on subsistence farming. 4. Possible Future Outcomes if Trends Continue If the current trends of increasing vulnerability and soil movement incidents persist, Kisoro District can anticipate: More Frequent and Severe Disasters: The district will likely experience more frequent and intense landslides, mudslides, and other soil movement events, leading to greater destruction. Mass Displacement and Humanitarian Crises: A significant increase in affected households could lead to large-scale displacement, creating humanitarian crises requiring extensive external aid and long-term resettlement programs. Economic Stagnation: Continuous destruction of infrastructure (roads, bridges, buildings) and agricultural land will severely impede economic development, deter investment, and perpetuate poverty. Increased Social Vulnerability: Communities will become more vulnerable, with potential for increased health issues, psychological trauma, and social disruption. Irreversible Environmental Damage: Continued unsustainable land use and climate impacts could lead to irreversible environmental damage, making the land unsuitable for habitation or agriculture in many areas. 5. Recommendations Urgent and comprehensive interventions are required to mitigate these risks. These include promoting sustainable land use practices, implementing early warning systems, investing in disaster-resilient infrastructure, and community-based disaster preparedness programs. Conclusion The data presents a clear call for immediate and strategic action to protect the lives and livelihoods of Kisoro District residents and ensure sustainable development. 3 done, 2 left today. You're making progress.