
We read your photo as:
Using the provided table of tourist arrivals and percentage differences, answer the following questions: 9.3.1) Which region showed the highest percentage of change? 9.3.2) Which region shows a declin
ScanSolve AI Answer
Step-by-step solution
6 stepsHere are the answers to your questions based on the provided table:
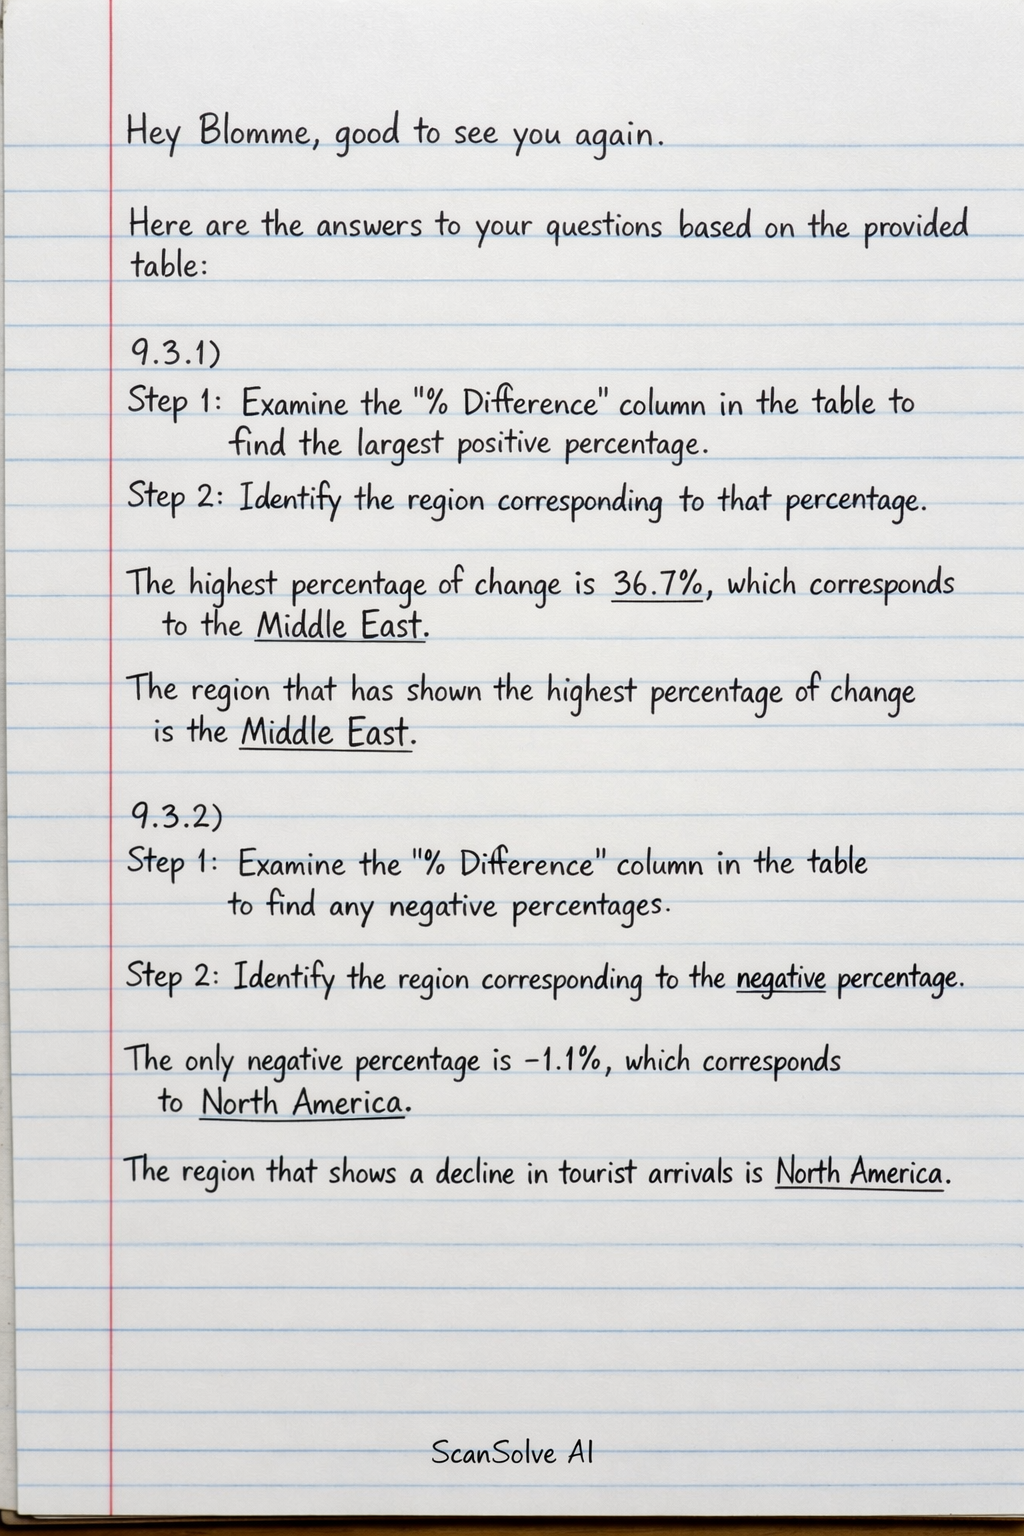
9.3.1)
Examine the "% Difference" column in the table to find the largest positive percentage.
Identify the region corresponding to that percentage.
The highest percentage of change is , which corresponds to the Middle East.
The region that has shown the highest percentage of change is the Middle East.9.3.2)
Examine the "% Difference" column in the table to find any negative percentages.
Identify the region corresponding to the negative percentage.
The only negative percentage is , which corresponds to North America.
The region that shows a decline in tourist arrivals is North America.9.3.3)
Identify the region with the highest number of tourists in April 2018 from the "April 2018" column.
The region with the highest number of tourists in April 2018 is Africa, with arrivals.
Provide one reason why this region (Africa) would have the highest number of tourists arriving in South Africa (implied by the source "www.tourism.gov.za").
One reason is geographical proximity, which often leads to lower travel costs and easier access for regional travel.
Still stuck on this one?
Ask a follow-up, and the answer starts from this question.
More Geography Questions
Handwritten Step-by-Step Solution
Get this as a handwritten image on WhatsApp — like a tutor wrote it for you.
Try on WhatsApp