
We read your photo as:
Draw a table showing the total number of deliveries made to each region and the percentage of total deliveries made to each region.
ScanSolve AI Answer
Answer
Step-by-step solution
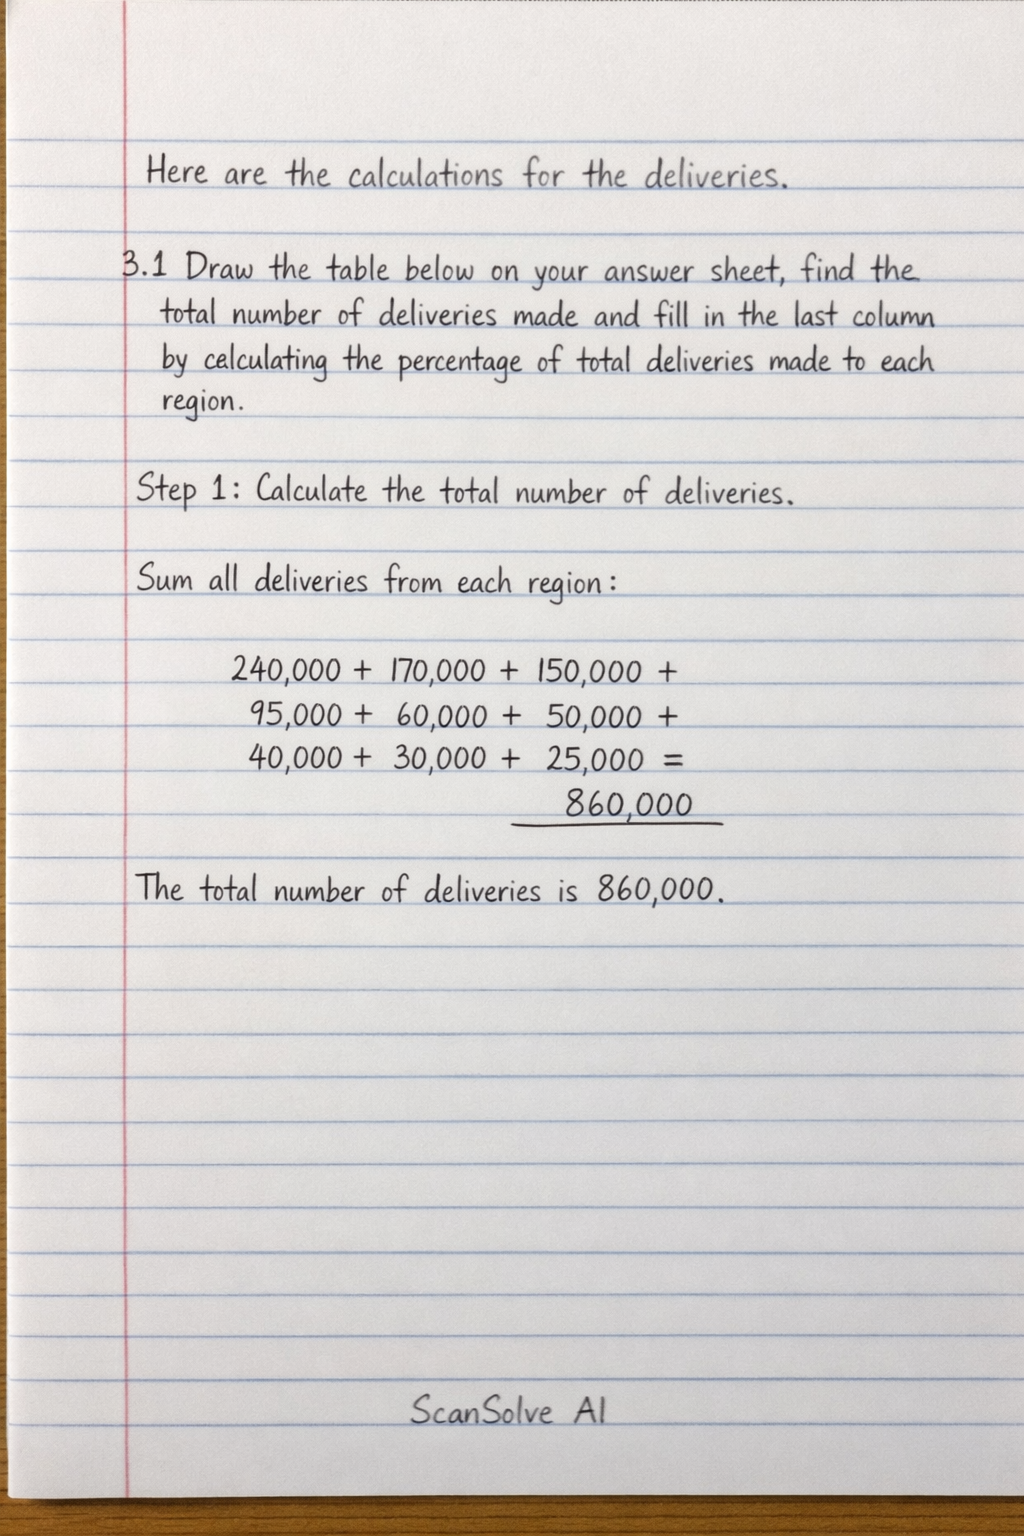
5 stepsHere are the calculations for the deliveries.
Part 3.1· 2 steps
Draw the table below on your answer sheet, find the total number of deliveries made and fill in the last column by calculating the percentage of total deliveries made to each region.
Calculate the total number of deliveries.
Sum all deliveries from each region:
The total number of deliveries is 860000.
Calculate the percentage of total deliveries for each region.
Percentage for a region =
- Gauteng:
- Western Cape:
- KwaZulu-Natal:
- Eastern Cape:
- Free State:
- Limpopo:
- Mpumalanga:
- North West:
- Northern Cape:
Here is the completed table:
Region Deliveries % of Total Deliveries Gauteng 240 000 27.91% Western Cape 170 000 19.77% KwaZulu-Natal 150 000 17.44% Eastern Cape 95 000 11.05% Free State 60 000 6.98% Limpopo 50 000 5.81% Mpumalanga 40 000 4.65% North West 30 000 3.49% Northern Cape 25 000 2.91% Total 860 000 100.01%
Part 3.2
Suppose the number of deliveries was increased by 10% in Gauteng whilst the others remained the same in September 2025. Calculate the new percentages of deliveries in Gauteng.
Calculate the new number of deliveries for Gauteng.
Original deliveries for Gauteng = 240000.
Increase = of .
New deliveries for Gauteng = .Calculate the new total number of deliveries.
Deliveries for other regions (excluding Gauteng) remain the same:
.
New total deliveries = New Gauteng deliveries + Sum of other regions' deliveries
New total deliveries = .Calculate the new percentage of deliveries for Gauteng.
New percentage for Gauteng =
The new percentage of deliveries in Gauteng is
\boxed{\text{29.86%}}.
Try one yourself
A new problem that tests the same skill.
Still stuck on this one?
Ask a follow-up, and the answer starts from this question.
More Mathematics Questions
Handwritten Step-by-Step Solution
Get this as a handwritten image on WhatsApp — like a tutor wrote it for you.
Try on WhatsApp