
This history question requires analysis of historical events, causes, and consequences. The detailed answer below provides context, evidence, and a well-structured explanation.
ScanSolve AI Answer
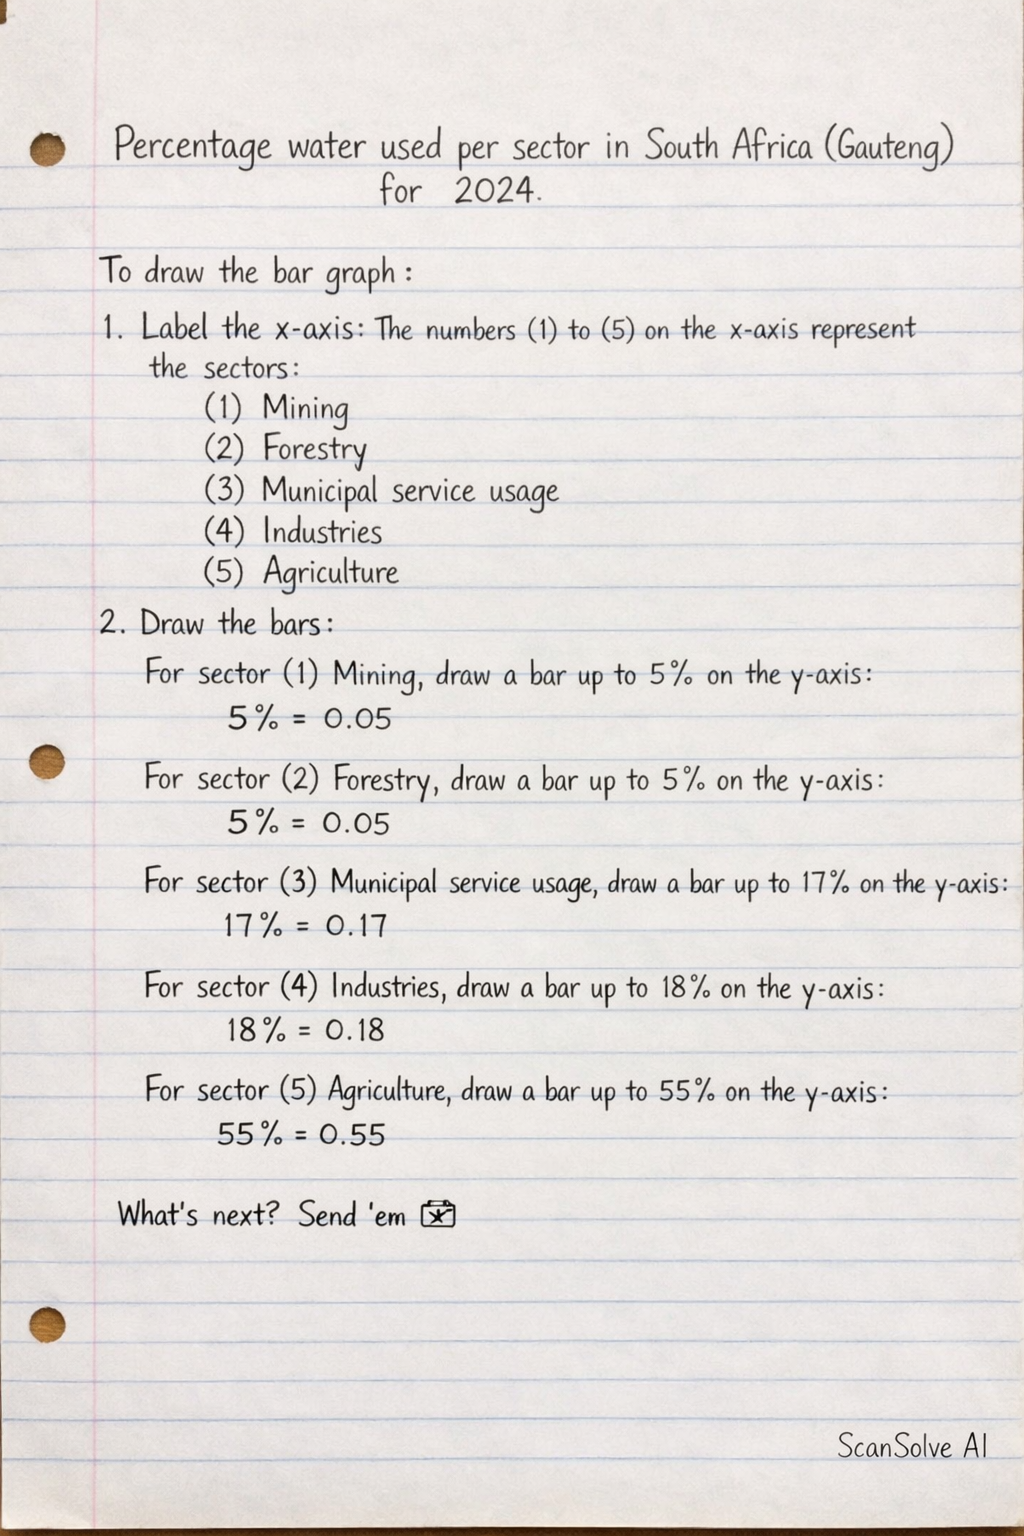
TITLE: Percentage water used per sector in South Africa (Gauteng) for 2024 To draw the bar graph: 1. Label the x-axis: The numbers (1) to (5) on the x-axis represent the sectors: (1) Mining (2) Forestry (3) Municipal service usage (4) Industries (5) Agriculture 2. Draw the bars: For sector (1) Mining, draw a bar extending up to 5\% on the y-axis. For sector (2) Forestry, draw a bar extending up to 5\% on the y-axis. For sector (3) Municipal service usage, draw a bar extending up to 17\% on the y-axis. For sector (4) Industries, draw a bar extending up to 18\% on the y-axis. For sector (5) Agriculture, draw a bar extending up to 55\% on the y-axis. What's next? Send 'em 📸