
We read your photo as:
A class of 100 students' marks are given in the table. Find the mean and median mark.
ScanSolve AI Answer
Answer
Step-by-step solution
4 stepsHere's the solution for question 2 from Section B.
2 (i) Class of 100 students' marks
Part a· 4 steps
Find the mean and median mark.
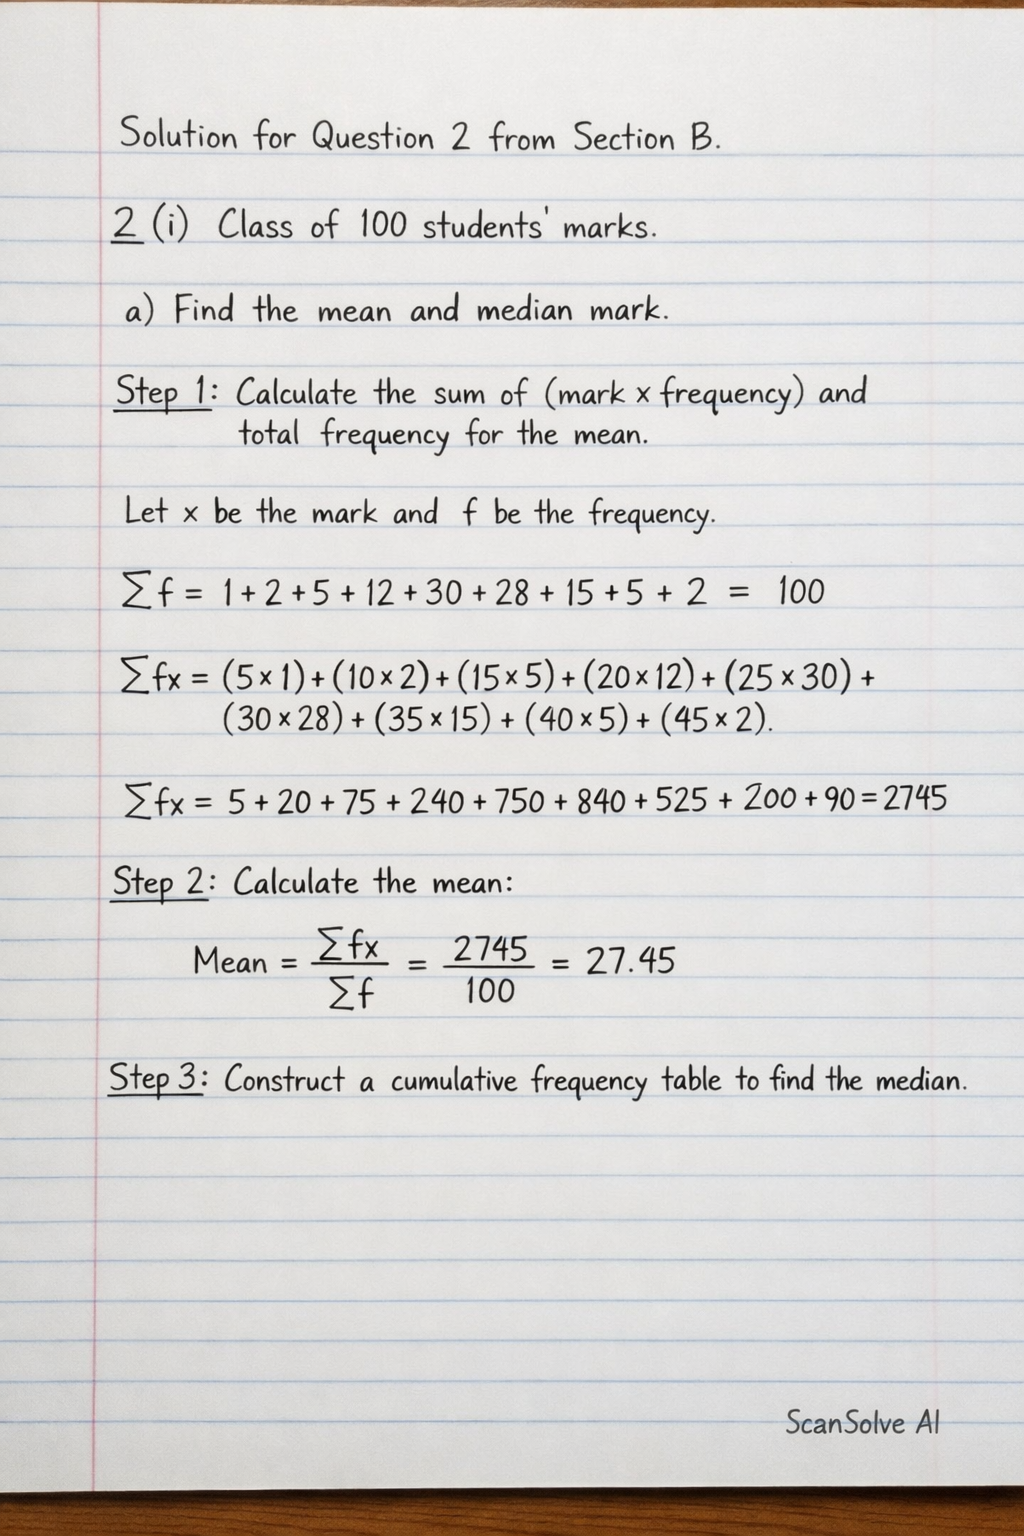
Calculate the sum of (mark frequency) and total frequency for the mean.
Let be the mark and be the frequency.
Calculate the mean.
Construct a cumulative frequency table to find the median.
Mark () Frequency () Cumulative Frequency (CF) 5 1 1 10 2 3 15 5 8 20 12 20 25 30 50 30 28 78 35 15 93 40 5 98 45 2 100 Determine the median.
Since the total number of students is (an even number), the median is the average of the -th and -th values.
The -th value.
The -st value.
From the cumulative frequency table:
The 50th value is 25 (as CF reaches 50 at mark 25).
The 51st value is 30 (as CF goes from 50 to 78 at mark 30).The mean mark is and the median mark is .
Part b
Construct the cumulative frequency table of distribution.
The cumulative frequency table is shown in Step 3 of part (a).
| Mark () | Frequency () | Cumulative Frequency (CF) |
|---|---|---|
| 5 | 1 | 1 |
| 10 | 2 | 3 |
| 15 | 5 | 8 |
| 20 | 12 | 20 |
| 25 | 30 | 50 |
| 30 | 28 | 78 |
| 35 | 15 | 93 |
| 40 | 5 | 98 |
| 45 | 2 | 100 |
Part c
On a graph paper, by taking 2cm to represent 5 units on the x-axis and 2cm for 10 units on the y-axis construct the cumulative frequency curve of this distribution.
To construct the cumulative frequency curve (ogive):
- Draw the x-axis (horizontal) for 'Mark' and the y-axis (vertical) for 'Cumulative Frequency'.
- Scale the x-axis: Mark 0, 5, 10, 15, ..., 45. Each 2cm represents 5 units.
- Scale the y-axis: Cumulative Frequency 0, 10, 20, ..., 100. Each 2cm represents 10 units.
- Plot the points using the (Mark, Cumulative Frequency) pairs from the table: (0, 0) - (This is a common starting point for an ogive) (5, 1) (10, 3) (15, 8) (20, 20) (25, 50) (30, 78) (35, 93) (40, 98) (45, 100)
- Draw a smooth curve connecting these plotted points. The curve should be S-shaped.
Try one yourself
A new problem that tests the same skill.
Still stuck on this one?
Ask a follow-up, and the answer starts from this question.
More Mathematics Questions
Handwritten Step-by-Step Solution
Get this as a handwritten image on WhatsApp — like a tutor wrote it for you.
Try on WhatsApp