
We read your photo as:
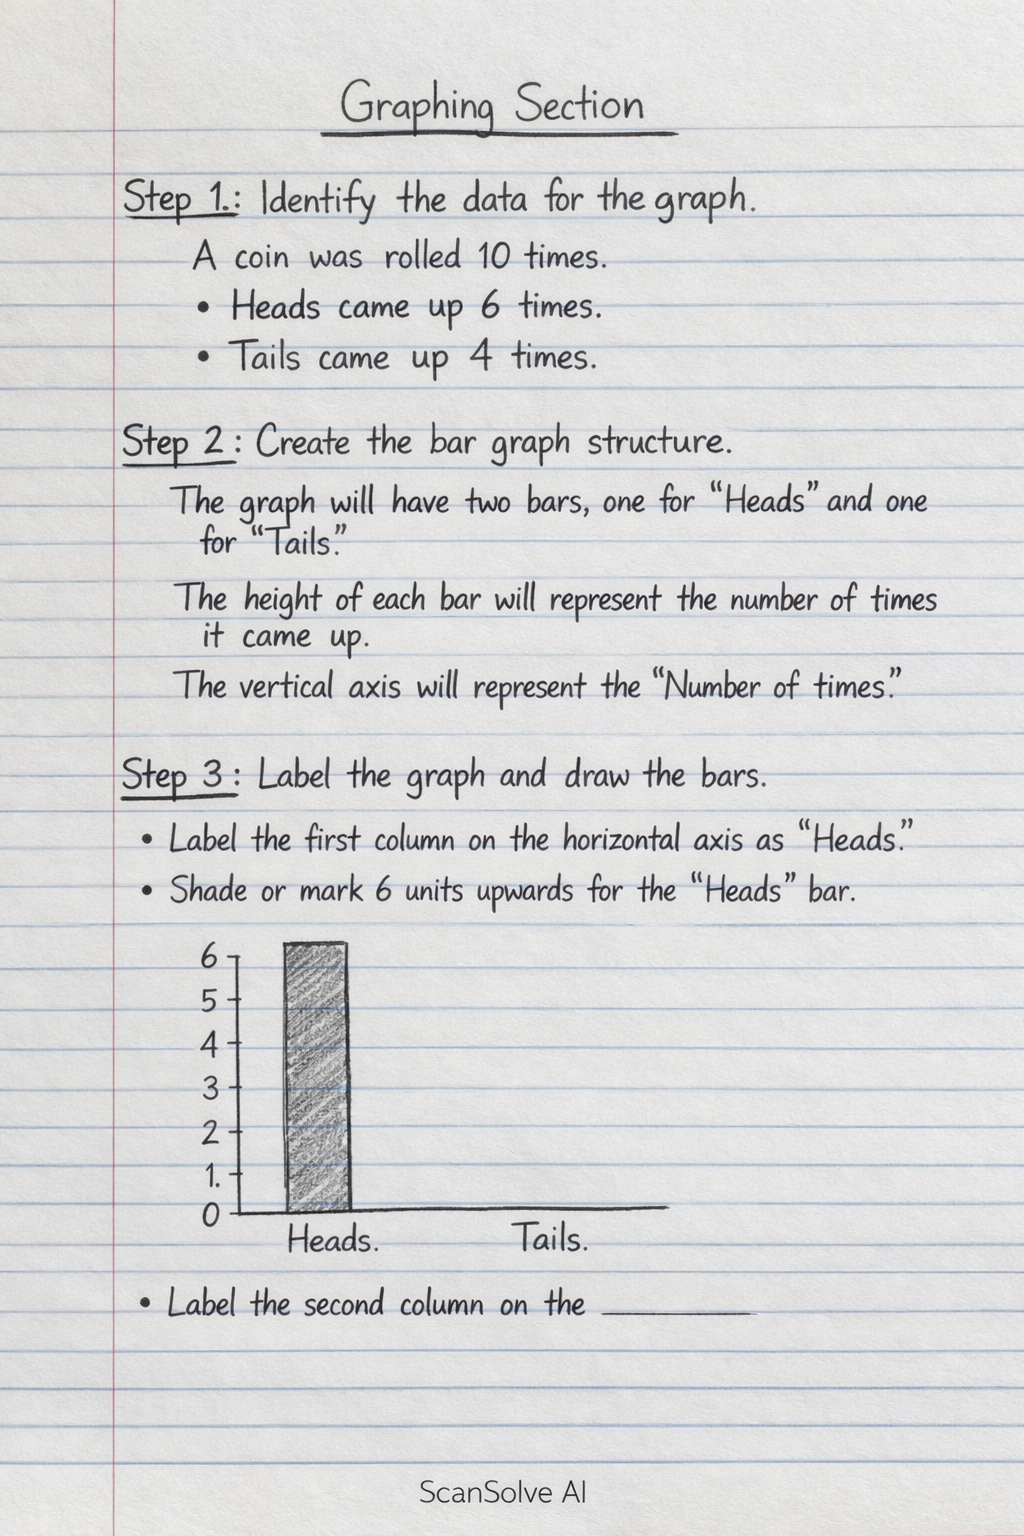
A coin was rolled 10 times, resulting in 6 heads and 4 tails. Create a bar graph to represent this data.
Mathematics
ScanSolve AI Answer
Step-by-step solution
3 stepsGraphing Section
Identify the data for the graph.
A coin was rolled 10 times.
- Heads came up 6 times.
- Tails came up 4 times.
Create the bar graph structure.
The graph will have two bars, one for "Heads" and one for "Tails". The height of each bar will represent the number of times it came up. The vertical axis will represent the "Number of times".
Label the graph and draw the bars.
- Label the first column on the horizontal axis as "Heads".
- Shade or mark 6 units upwards for the "Heads" bar.
- Label the second column on the
Was this helpful?
Still stuck on this one?
Ask a follow-up, and the answer starts from this question.
Got a different question?Ask your own question
More Mathematics Questions
QA coin is tossed 100 times, and the relative frequency of heads is 0.6. If 40 of the first 50 tosses…Q1.1. A coin is tossed and a dice is rolled. 9.1.2. Represent the above scenario in a tree diagram…QA coin tossed three times, find the probability of getting: (i) 3 heads (ii) Not 3 heads (iii) At…QDie is rolled and a coin is tossed. 2. Find the probability of an even number of a head. 3. Find the…QA coin is tossed three times. Calculate probability that the first and third - coin loses give heads…
Browse by topic:Statistics
Handwritten Step-by-Step Solution
Get this as a handwritten image on WhatsApp — like a tutor wrote it for you.
Try on WhatsApp