
We read your photo as:
A group of learners wrote a standardised English test that was scored out of 60. The results were represented in a cumulative frequency graph below. How many learners wrote the test?
ScanSolve AI Answer
Answers
3 partsStep-by-step solution
5 stepsHere's the solution to Question 2 based on the cumulative frequency graph.
Part 2.1· 1 step
How many learners wrote the test.
Identify the maximum cumulative frequency on the graph.
The graph shows that the cumulative frequency reaches its maximum value and flattens out at 80. This represents the total number of learners who wrote the test.
The number of learners who wrote the test is .
Part 2.2
How many learners scored at least 20 out 60?
Find the number of learners who scored less than 20 marks.
Locate 20 on the "Marks obtained" (x-axis). Move vertically up to the curve, then horizontally to the "Cumulative Frequency" (y-axis).
At 20 marks, the cumulative frequency is 20. This means 20 learners scored less than 20 marks.Calculate the number of learners who scored at least 20 marks.
Subtract the number of learners who scored less than 20 from the total number of learners.
The number of learners who scored at least 20 out of 60 is .
Part 2.3
Using the graph, estimate the median test score.
Determine the position of the median.
The median is the middle value. For 80 learners, the median position is at .
Locate the median cumulative frequency on the y-axis and find the corresponding mark.
Find 40 on the "Cumulative Frequency" (y-axis). Move horizontally across to the curve, then vertically down to the "Marks obtained" (x-axis).
The corresponding mark is approximately 30.
The estimated median test score is .
Try one yourself
A new problem that tests the same skill.
Still stuck on this one?
Ask a follow-up, and the answer starts from this question.
More Mathematics Questions
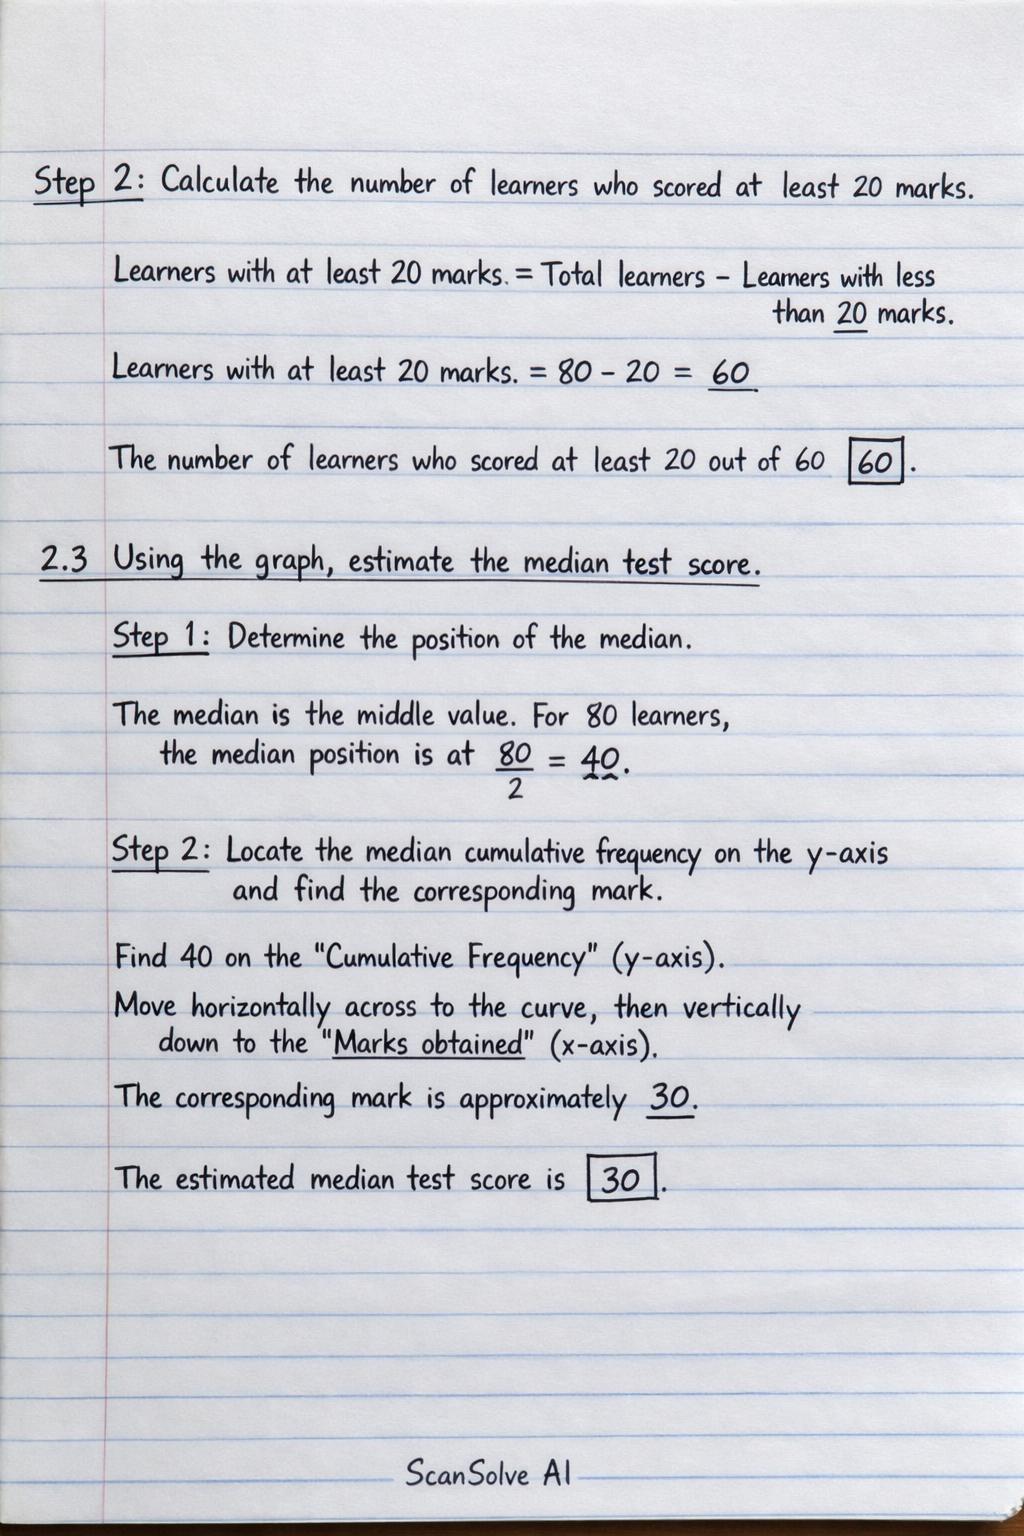
Handwritten Step-by-Step Solution
Get this as a handwritten image on WhatsApp — like a tutor wrote it for you.
Try on WhatsApp