
We read your photo as:
A student is investigating linear graphs. They have completed a table showing the gradients and y-intercepts of three linear equations and have plotted the graphs. The student needs help writing up th
ScanSolve AI Answer
Answer
2.1:
The standard equation of a linear graph is given by the slope-intercept form.
where is the gradient (slope) and is the y-intercept.
2.2.1:
To complete the table, we need three linear equations. The problem provides one row with a gradient of 2 and a y-intercept of 0, which corresponds to the equation . We will assume this is the "mother graph" for investigation. For the other two rows, we will choose variations to investigate the effect of changing the gradient and the y-intercept.
Let's choose:
- A graph with a different gradient but the same y-intercept as . For example, .
- A graph with the same gradient but a different y-intercept as . For example, .
Completing the table:
| Equation | Gradient | Y-intercept |
|---|---|---|
| 1 | 0 | |
| 2 | 0 | |
| 2 | 1 |
2.2.2:
Based on the completed table, the gradients of the 3 linear graphs are:
1, 2, 2
2.2.3:
To plot the three graphs, we find a few points for each equation:
-
For :
- If ,
- If ,
- If , Plot points , , and draw a straight line through them.
-
For :
- If ,
- If ,
- If , Plot points , , and draw a straight line through them.
-
For :
- If ,
- If ,
- If , Plot points , , and draw a straight line through them.
The completed table and the gradients are:
- 2.1:
- 2.2.1:
Equation Gradient Y-intercept 1 0 2 0 2 1 - 2.2.2: The gradients of the 3 linear graphs are .
- 2.2.3: Plot the lines , , and on the provided Cartesian plane using the points calculated above.
Try one yourself
A new problem that tests the same skill.
Still stuck on this one?
Ask a follow-up, and the answer starts from this question.
More Mathematics Questions
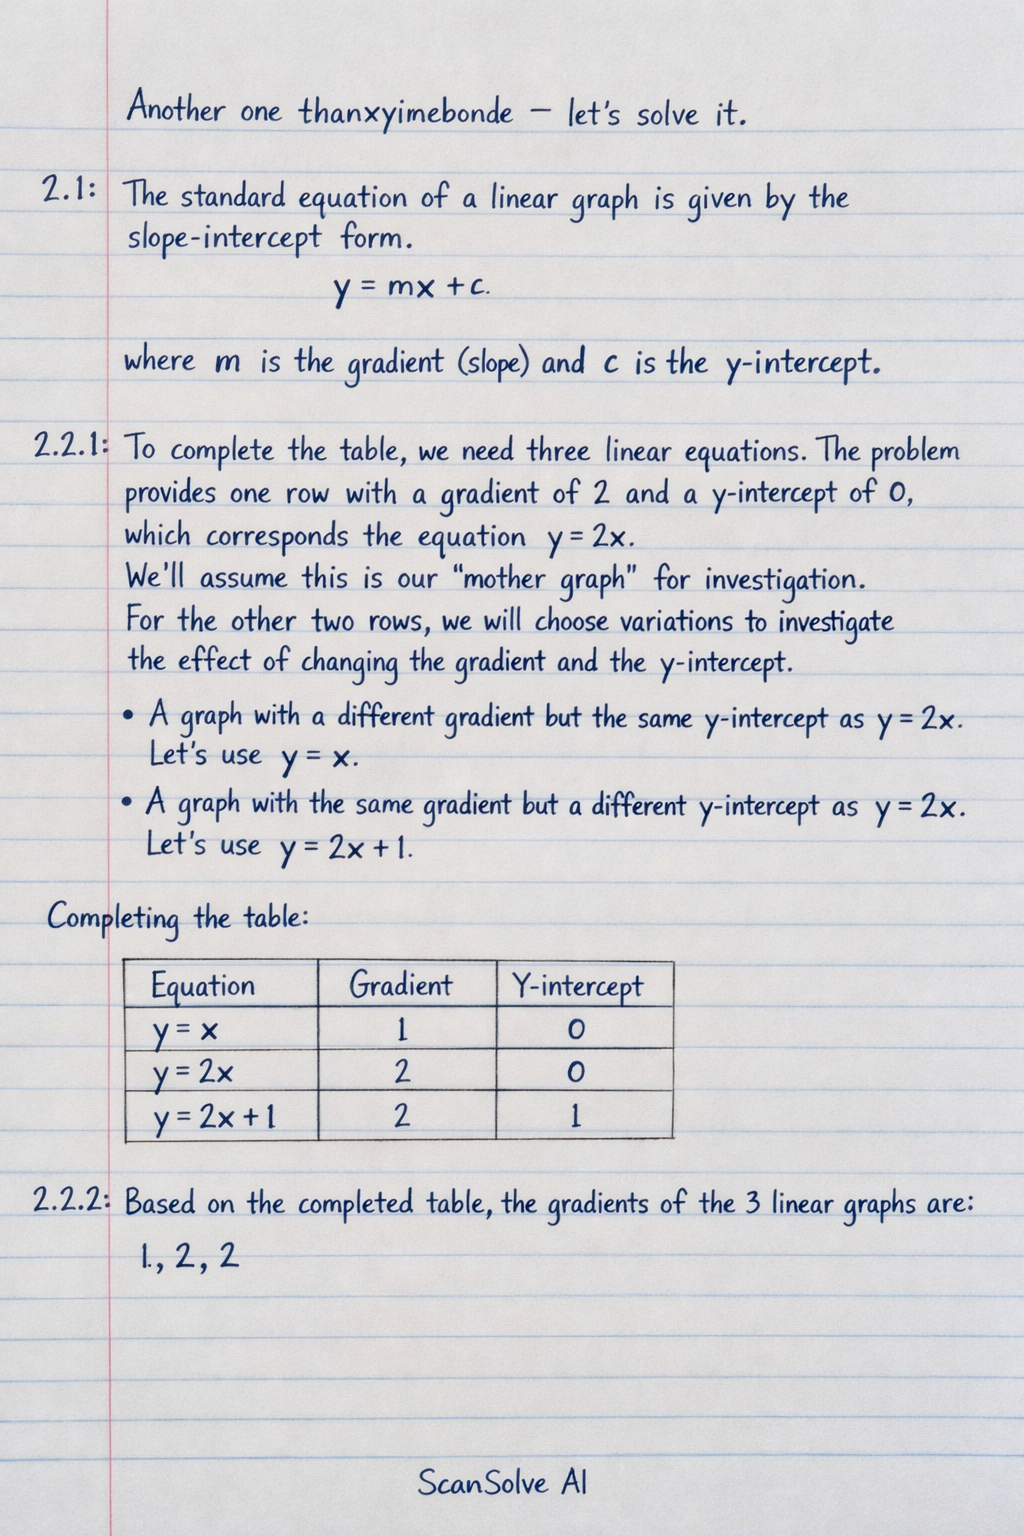
Handwritten Step-by-Step Solution
Get this as a handwritten image on WhatsApp — like a tutor wrote it for you.
Try on WhatsApp