
We read your photo as:
A teacher is analysing the study habits of students. The number of hours that students studied per week over 10 weeks is: 12, 15, 14, 10, 16, 20, 18, 17, 13, 11. Calculate the mean and standard deviat
ScanSolve AI Answer
Answers
3 partsStep-by-step solution
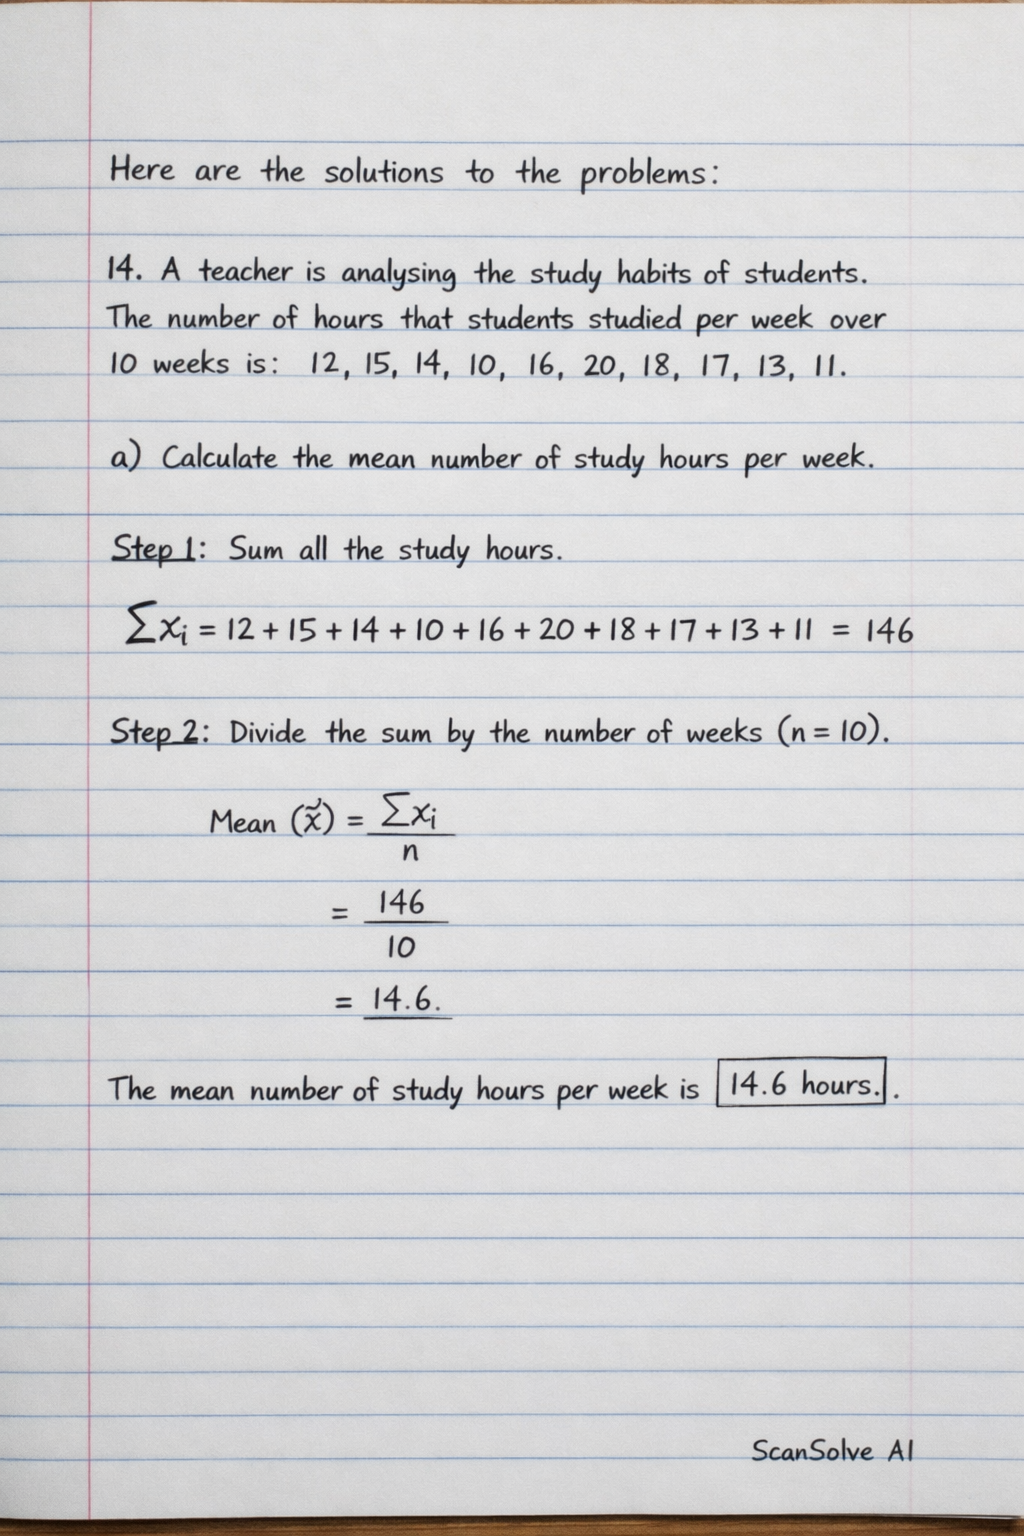
13 stepsHere are the solutions to the problems:
14. A teacher is analysing the study habits of students. The number of hours that students studied per week over 10 weeks is: 12, 15, 14, 10, 16, 20, 18, 17, 13, 11.
Part a· 2 steps
Calculate the mean number of study hours per week.
Sum all the study hours.
Divide the sum by the number of weeks ().
The mean number of study hours per week is .
Part b
Determine the standard deviation of the study hours.
Calculate the squared difference of each data point from the mean ().
Sum the squared differences.
Calculate the sample variance by dividing the sum of squared differences by (since this is a sample of weeks).
Calculate the standard deviation by taking the square root of the variance.
The standard deviation of the study hours is approximately .
Part c
Discuss the significance of the standard deviation in understanding the study patterns of the students.
The standard deviation measures the spread or variability of the study hours around the mean. A smaller standard deviation indicates that the students' weekly study hours are consistently close to the average, suggesting a stable study pattern. A larger standard deviation, like the 3.17 hours calculated, suggests more variability in study times, meaning students' study habits fluctuate more from week to week.
15. A dataset has the following values: 3, 5, 7, 9, 11. Calculate the variance (population variance).
Calculate the population mean ().
Calculate the squared difference of each data point from the mean.
Sum the squared differences.
Calculate the population variance () by dividing the sum of squared differences by the number of data points ().
The population variance is .
16. For the dataset: 2, 4, 6, 8, 10, 12, find Q1 and Q3.
The dataset is already sorted: 2, 4, 6, 8, 10, 12. There are data points.Find the median ().
Since there are 6 data points (an even number), the median is the average of the 3rd and 4th values.
Find the first quartile ().
is the median of the lower half of the data. The lower half is 2, 4, 6.
The median of (2, 4, 6) is the middle value, which is 4.Find the third quartile ().
is the median of the upper half of the data. The upper half is 8, 10, 12.
The median of (8, 10, 12) is the middle value, which is 10.The first quartile () is and the third quartile () is .
Try one yourself
A new problem that tests the same skill.
Still stuck on this one?
Ask a follow-up, and the answer starts from this question.
More Mathematics Questions
Handwritten Step-by-Step Solution
Get this as a handwritten image on WhatsApp — like a tutor wrote it for you.
Try on WhatsApp