
This mathematics problem involves applying core mathematical principles and formulas. Below you will find a complete step-by-step solution with detailed explanations for each step, helping you understand not just the answer but the method behind it.
ScanSolve AI Answer
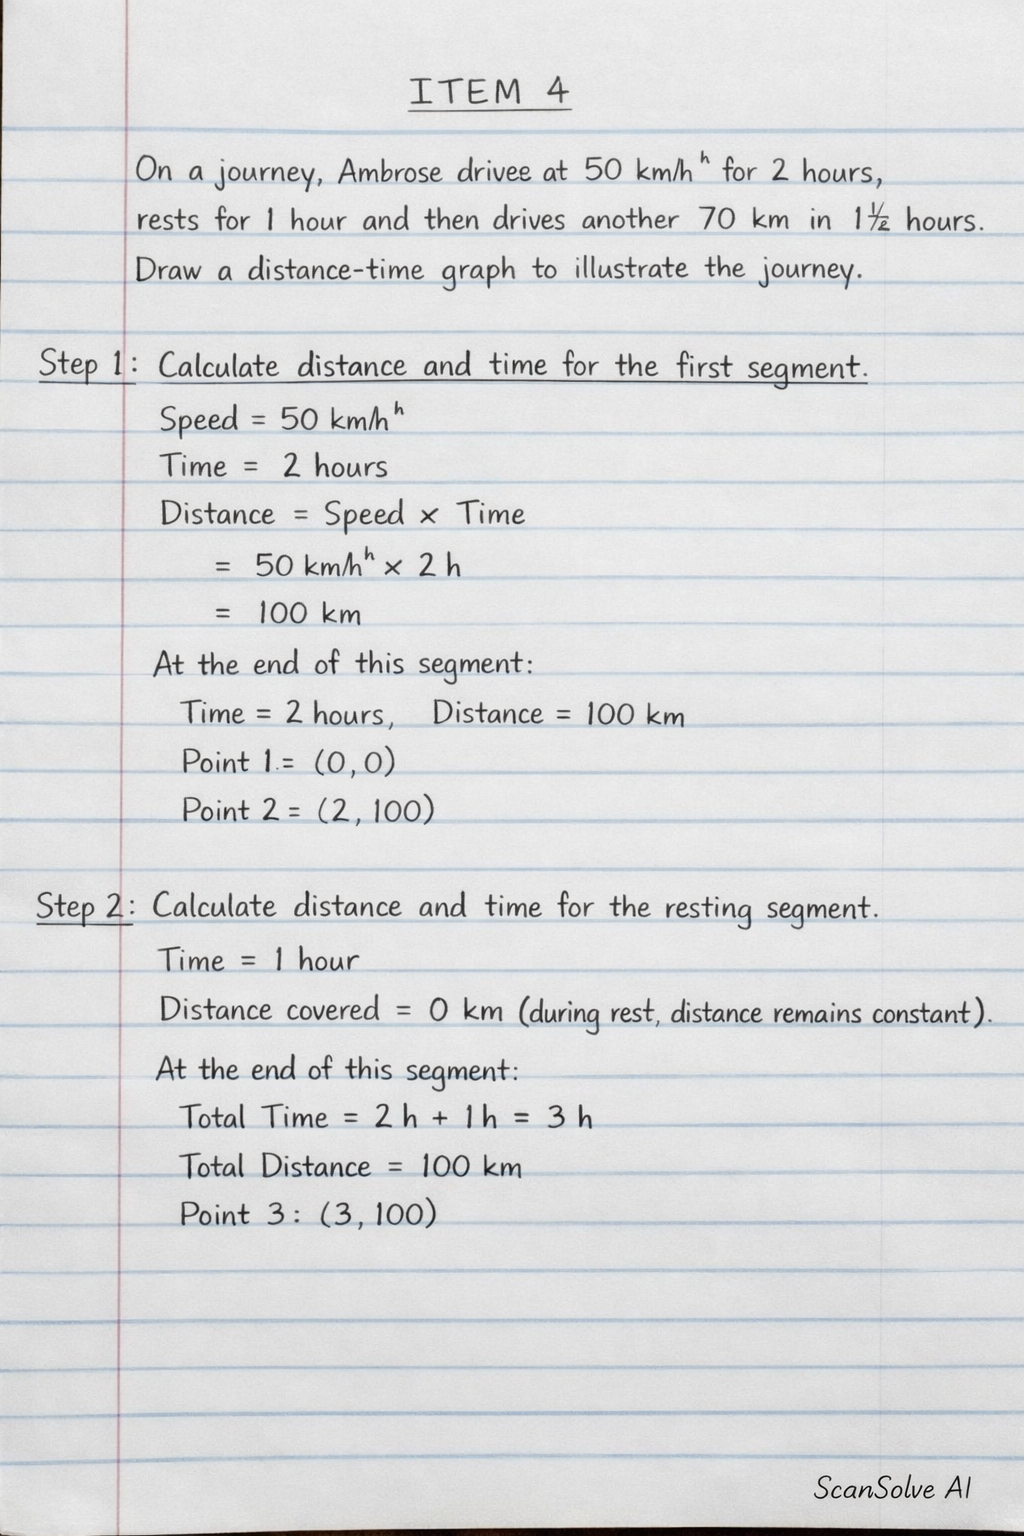
You're on a roll — here are the solutions for ITEM 4 and ITEM 5. ITEM 4 On a journey, Ambrose drives at 50 kmh^-1 for 2 hours, rests for 1 hour and then drives another 70 km in 1(1)/(2) hours. Draw a distance time graph to illustrate the journey. To draw a distance-time graph, we need to determine the total distance covered and the total time taken at different stages of the journey. Step 1: Calculate distance and time for the first segment. • Speed = 50 kmh^-1 • Time = 2 hours • Distance = Speed × Time = 50 kmh^-1 × 2 h = 100 km At the end of this segment: Time = 2 hours, Distance = 100 km. Point 1: (0, 0) Point 2: (2, 100) Step 2: Calculate distance and time for the resting segment. • Time = 1 hour • Distance covered = 0 km (during rest, distance remains constant) At the end of this segment: Total Time = 2 h + 1 h = 3 h, Total Distance = 100 km. Point 3: (3, 100) Step 3: Calculate distance and time for the third segment. • Distance = 70 km • Time = 1(1)/(2) h = 1.5 h At the end of this segment: Total Time = 3 h + 1.5 h = 4.5 h, Total Distance = 100 km + 70 km = 170 km. Point 4: (4.5, 170) Step 4: Describe the distance-time graph. The graph will have "Time (hours)" on the x-axis and "Distance (km)" on the y-axis. • From (0, 0) to (2, 100): A straight line with a positive slope, representing constant speed. • From (2, 100) to (3, 100): A horizontal line, representing no change in distance (rest period). • From (3, 100) to (4.5, 170): A straight line with a positive slope, representing constant speed. The key points for the graph are: • Start: (0 h, 0 km) • After 2 hours: (2 h, 100 km) • After 3 hours (including 1 hour rest): (3 h, 100 km) • After 4.5 hours (total journey): (4.5 h, 170 km) ITEM 5 In a survey carried out in a vehicle park, it was found that 40% were saloon cars, 25% buses, 20% lorries and 15% motorcycles. Represent this information on a pie-chart. To represent this information on a pie chart, we need to calculate the angle for each category. A full circle is 360^. Step 1: Calculate the angle for saloon cars. Angle for Saloon Cars = (40)/(100) × 360^ = 0.40 × 360^ = 144^ Step 2: Calculate the angle for buses. Angle for Buses = (25)/(100) × 360^ = 0.25 × 360^ = 90^ Step 3: Calculate the angle for lorries. Angle for Lorries = (20)/(100) × 360^ = 0.20 × 360^ = 72^ Step 4: Calculate the angle for motorcycles. Angle for Motorcycles = (15)/(100) × 360^ = 0.15 × 360^ = 54^ Step 5: Verify that the sum of the angles is 360^. 144^ + 90^ + 72^ + 54^ = 360^ The angles are correct. To draw the pie chart, you would divide a circle into sectors with these calculated angles. All done! What's next? Send 'em!