
We read your photo as:
Bar diagram different pillars
Mathematics
ScanSolve AI Answer
Step-by-step solution
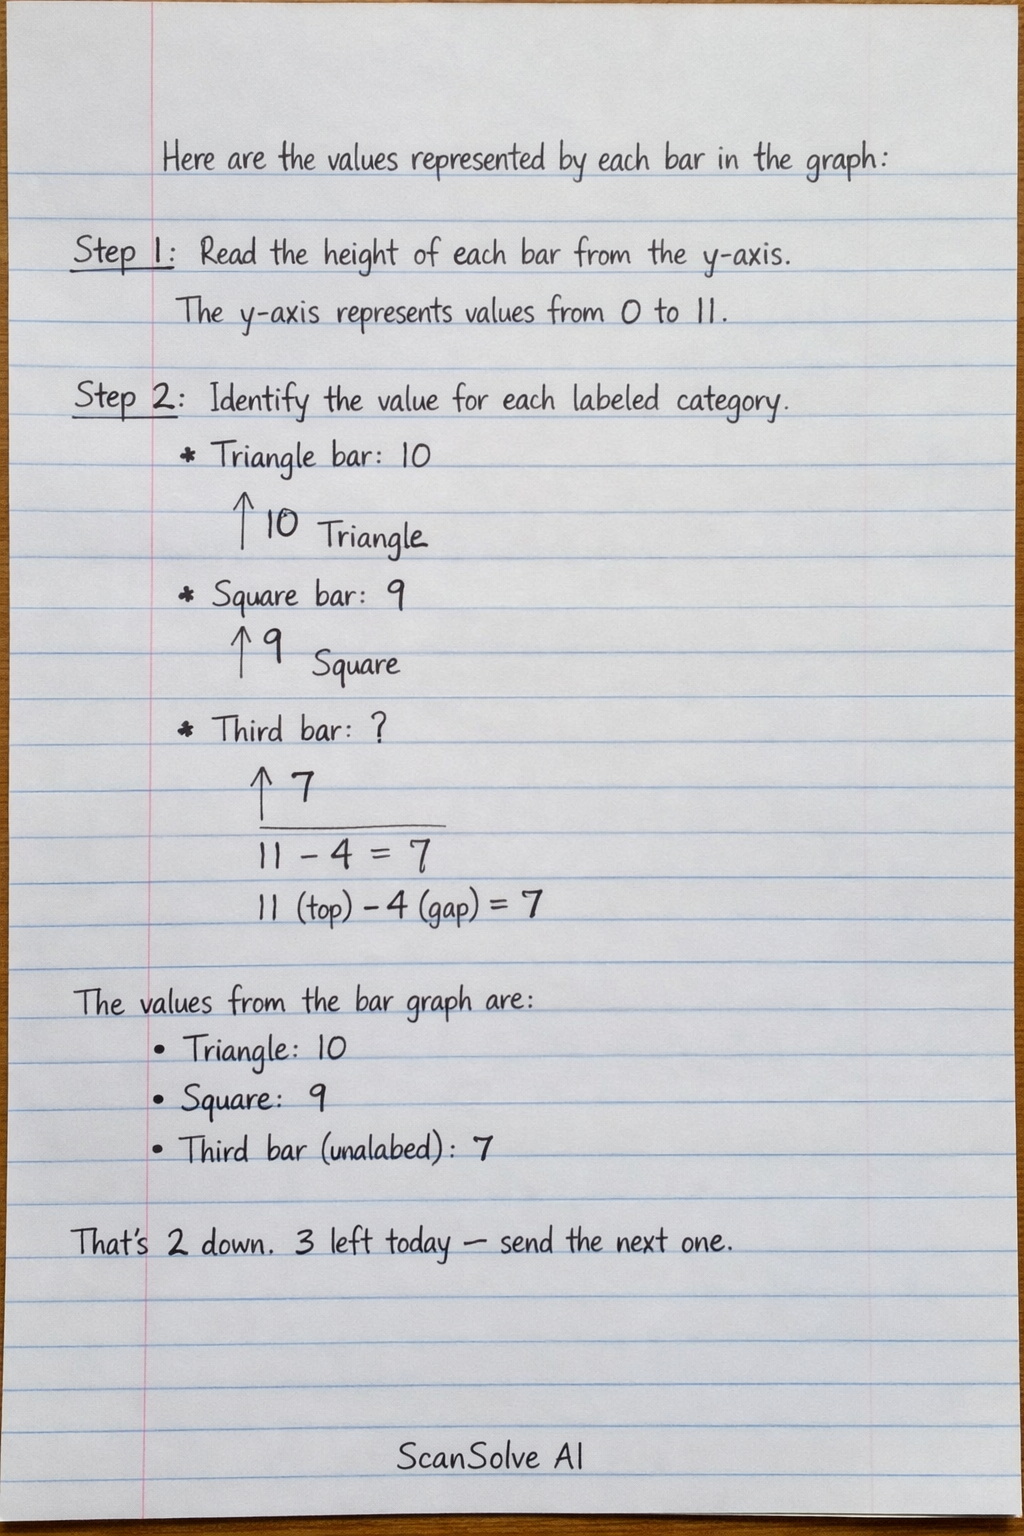
2 stepsHere are the values represented by each bar in the graph:
Read the height of each bar from the y-axis.
The y-axis represents values from 0 to 11.
Identify the value for each labeled category.
- The bar labeled "Triangle" reaches a height of 10.
- The bar labeled "Square" reaches a height of 9.
- The third visible bar (to the right of "Square") reaches a height of 7.
The values from the bar graph are:
- Triangle: 10
- Square: 9
- Third bar (unlabeled): 7
Was this helpful?
Still stuck on this one?
Ask a follow-up, and the answer starts from this question.
Got a different question?Ask your own question
More Mathematics Questions
Handwritten Step-by-Step Solution
Get this as a handwritten image on WhatsApp — like a tutor wrote it for you.
Try on WhatsApp