
Needs the graph diagram
ScanSolve AI Answer
Step-by-step solution
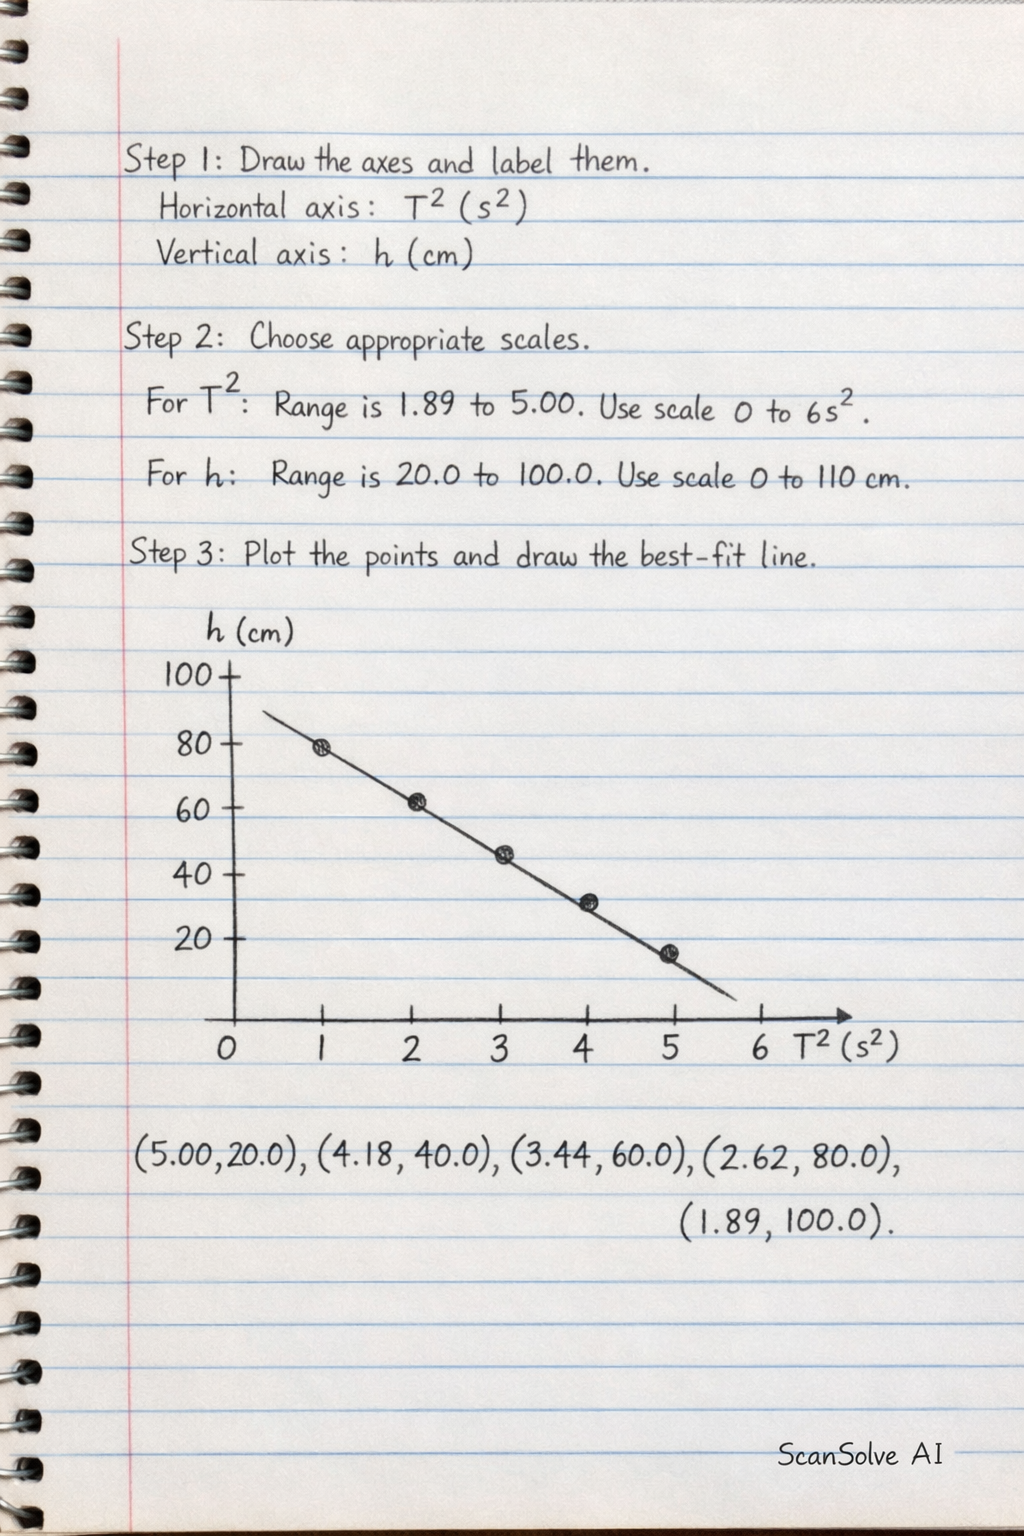
3 stepsHere is the graph diagram based on the data calculated previously.
The completed data points for plotting are:
, , , , .
Draw the axes and label them.
The horizontal axis is (s²) and the vertical axis is (cm).
Choose appropriate scales.
For : The range is from approximately 1.89 to 5.00. A scale from 0 to 6 s² would be suitable.
For : The range is from 20.0 to 100.0. A scale from 0 to 110 cm would be suitable.Plot the points and draw the best-fit line.
The graph shows on the vertical axis against on the horizontal axis. The points are plotted, and a straight line is drawn to best fit these points, indicating a linear relationship with a negative gradient.
\begin{tikzpicture}[scale=0.8]
    % Axes
    \draw[->] (0,0) -- (7,0) node[right] {$T^2$ (s$^2$)};
    \draw[->] (0,0) -- (0,12) node[above] {$h$ (cm)};

    % X-axis ticks and labels
    \foreach \x in {1,2,3,4,5,6}
        \draw (\x, -0.1) -- (\x, 0.1) node[below] {\x};

    % Y-axis ticks and labels
    \foreach \y in {2,4,6,8,10}
        \draw (-0.1, \y) -- (0.1, \y) node[left] {\pgfmathparse{\y*10}\pgfmathprintnumber{\pgfmathresult}};

    % Data points (T^2, h)
    % (5.00, 20.0) -> (5, 2)
    % (4.18, 40.0) -> (4.18, 4)
    % (3.44, 60.0) -> (3.44, 6)
    % (2.62, 80.0) -> (2.62, 8)
    % (1.89, 100.0) -> (1.89, 10)

    \fill (5, 2) circle (2pt) node[above right] {};
    \fill (4.18, 4) circle (2pt) node[above right] {};
    \fill (3.44, 6) circle (2pt) node[above right] {};
    \fill (2.62, 8) circle (2pt) node[above right] {};
    \fill (1.89, 10) circle (2pt) node[above right] {};

    % Best-fit line (approximated)
    \draw[thick, blue] (1.5, 10.5) -- (5.5, 1.5);
\end{tikzpicture}
The graph shows a straight line with a negative gradient.
Still stuck on this one?
Ask a follow-up, and the answer starts from this question.
More Physics Questions
Handwritten Step-by-Step Solution
Get this as a handwritten image on WhatsApp — like a tutor wrote it for you.
Try on WhatsApp