
We read your photo as:
Betina has 42 Kg of rice costing K640 per Kg. She wants to add rice costing K820 per Kg to make a mixture that costs K760 per Kg. How many kilograms of the K820 rice should she add?
ScanSolve AI Answer
Answer
Step-by-step solution
9 steps13. To find how many kilograms of rice Betina should add:
Let be the number of kilograms of rice costing K820 per Kg that Betina adds.
Step 1: Calculate the total cost of the initial rice.
Initial rice: 42 Kg at K640 per Kg.
Step 2: Calculate the total cost of the added rice.
Added rice: Kg at K820 per Kg.
Step 3: Calculate the total mass of the mixture.
Step 4: Calculate the total cost of the mixture.
The mixture should cost K760 per Kg.
Step 5: Set up the equation where the sum of individual costs equals the total cost of the mixture.
Step 6: Solve the equation for .
Subtract from both sides:
Subtract 26880 from both sides:
Divide by 60:
Betina must add 84 Kg of rice.
The final answer is .
14. In one Mathematics continuous assessment, the following marks were obtained by top ten performing students: 37, 36, 37, 35, 37, 35, 37, 36, 38, 36.
Part i· 4 steps
Draw a bar graph to illustrate the given information.
Create a frequency table for the given marks.
- Mark 35: Appears 2 times
- Mark 36: Appears 3 times
- Mark 37: Appears 4 times
- Mark 38: Appears 1 time
Draw the axes.
- Draw a horizontal axis (x-axis) and label it "Marks".
- Draw a vertical axis (y-axis) and label it "Number of Students" or "Frequency".
Choose a suitable scale for the y-axis.
- The maximum frequency is 4, so the y-axis should go up to at least 4 or 5. A scale of 1 unit per grid line is appropriate.
Draw the bars.
- For each mark, draw a bar whose height corresponds to its frequency.
- Ensure the bars have equal width and are equally spaced from each other.
Here is a description of the bar graph:
- X-axis (Marks): Label points at 35, 36, 37, 38.
- Y-axis (Number of Students): Label points at 0, 1, 2, 3, 4.
- Bar for Mark 35: Height up to 2.
- Bar for Mark 36: Height up to 3.
- Bar for Mark 37: Height up to 4.
- Bar for Mark 38: Height up to 1.
Part ii36.5
Find the median for the given marks.
Arrange the marks in ascending order.
Determine the number of data points ().
There are 10 marks, so .
Find the position of the median.
Since is an even number, the median is the average of the two middle values. These are the and values.
- value
- value
Identify the 5th and 6th values from the ordered list.
The 5th value is 36.
The 6th value is 37.Calculate the median.
The median mark is .
Try one yourself
A new problem that tests the same skill.
Still stuck on this one?
Ask a follow-up, and the answer starts from this question.
More Mathematics Questions
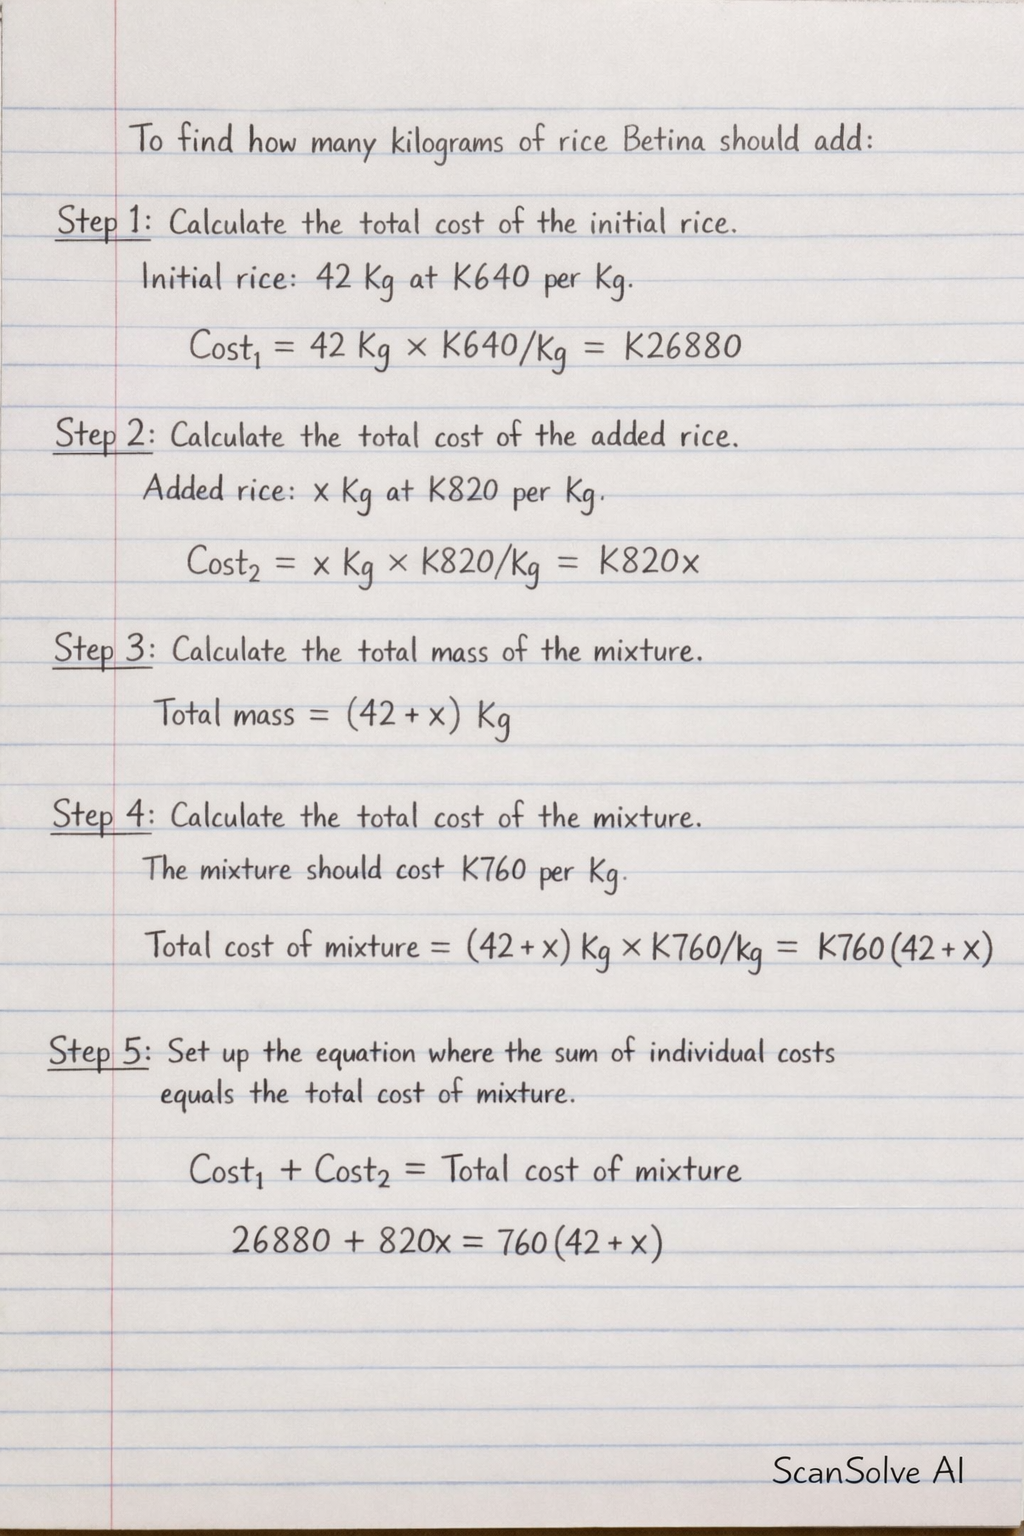
Handwritten Step-by-Step Solution
Get this as a handwritten image on WhatsApp — like a tutor wrote it for you.
Try on WhatsApp