
This mathematics problem involves applying core mathematical principles and formulas. Below you will find a complete step-by-step solution with detailed explanations for each step, helping you understand not just the answer but the method behind it.
ScanSolve AI Answer
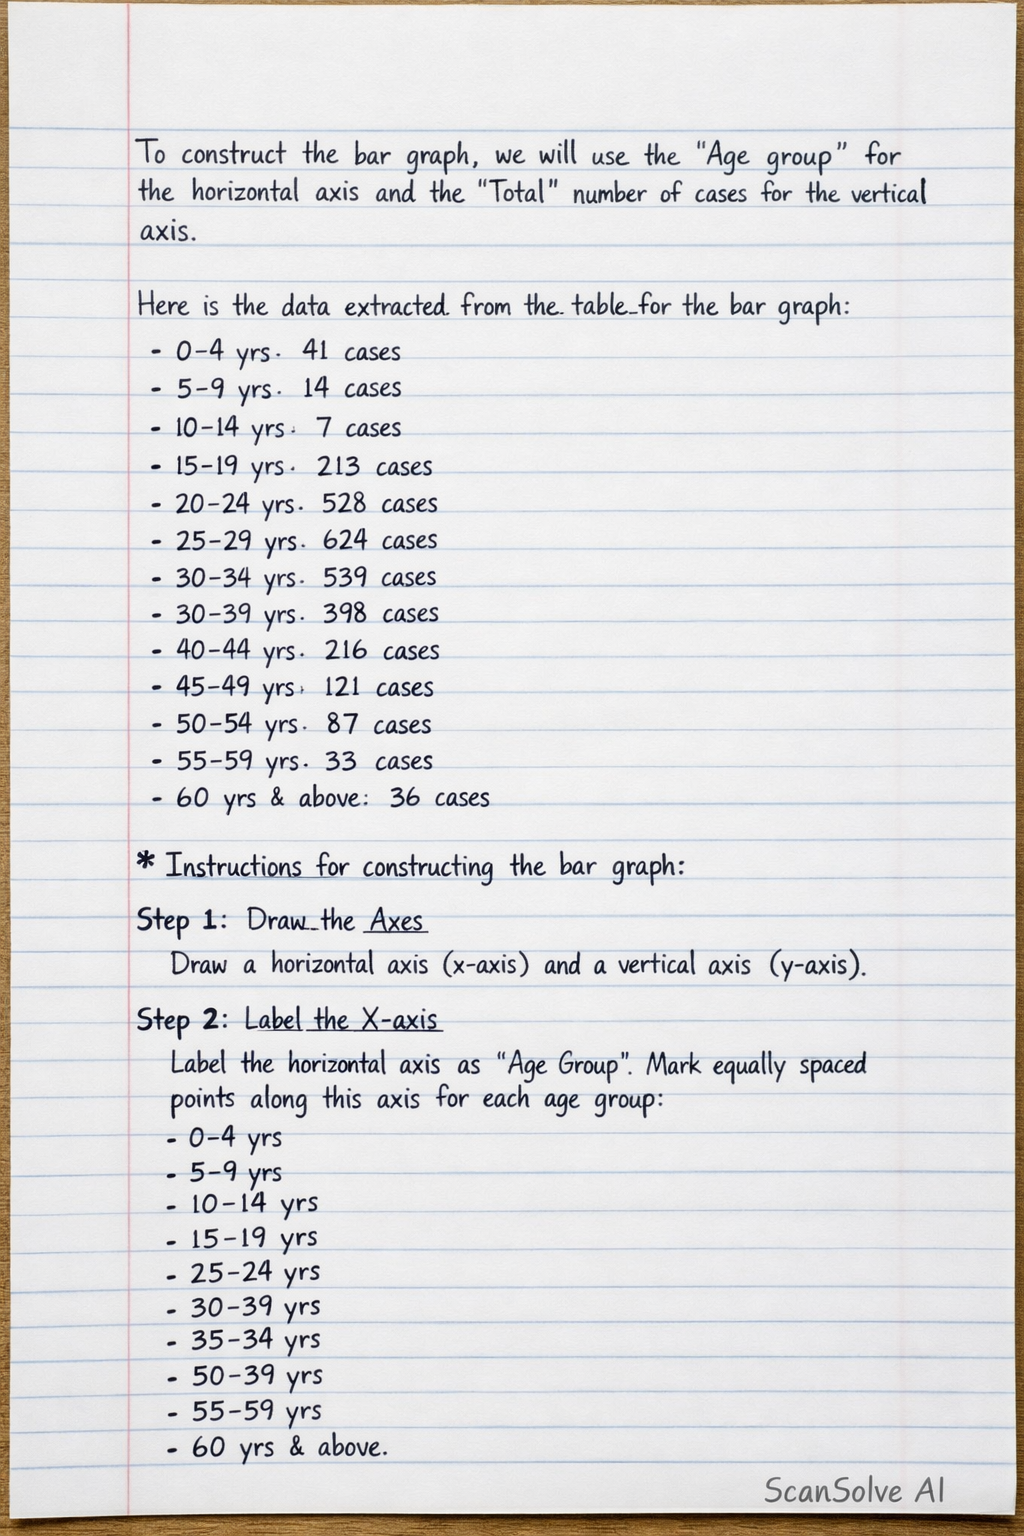
To construct the bar graph, we will use the 'Age group' for the horizontal axis and the 'Total' number of cases for the vertical axis. Here is the data extracted from the table for the bar graph: 0-4 yrs: 41 cases 5-9 yrs: 14 cases 10-14 yrs: 7 cases 15-19 yrs: 213 cases 20-24 yrs: 528 cases 25-29 yrs: 624 cases 30-34 yrs: 539 cases 35-39 yrs: 398 cases 40-44 yrs: 216 cases 45-49 yrs: 121 cases 50-54 yrs: 87 cases 55-59 yrs: 33 cases 60 yrs above: 36 cases Instructions for constructing the bar graph: Step 1: Draw the Axes Draw a horizontal axis (x-axis) and a vertical axis (y-axis). Step 2: Label the X-axis Label the horizontal axis as "Age Group". Mark equally spaced points along this axis for each age group: 0-4 yrs, 5-9 yrs, 10-14 yrs, 15-19 yrs, 20-24 yrs, 25-29 yrs, 30-34 yrs, 35-39 yrs, 40-44 yrs, 45-49 yrs, 50-54 yrs, 55-59 yrs, 60 yrs above. Step 3: Label and Scale the Y-axis Label the vertical axis as "Total Number of Cases". The highest value is 624, so scale the y-axis from 0 to at least 650 (e.g., up to 700). Mark increments, for example, every 100 units (0, 100, 200, 300, 400, 500, 600, 700). Step 4: Draw the Bars For each age group on the x-axis, draw a vertical bar with a height corresponding to its total number of cases: For "0-4 yrs", draw a bar up to 41. For "5-9 yrs", draw a bar up to 14. For "10-14 yrs", draw a bar up to 7. For "15-19 yrs", draw a bar up to 213. For "20-24 yrs", draw a bar up to 528. For "25-29 yrs", draw a bar up to 624. For "30-34 yrs", draw a bar up to 539. For "35-39 yrs", draw a bar up to 398. For "40-44 yrs", draw a bar up to 216. For "45-49 yrs", draw a bar up to 121. For "50-54 yrs", draw a bar up to 87. For "55-59 yrs", draw a bar up to 33. For "60 yrs above", draw a bar up to 36. Ensure all bars are of equal width and have equal spacing between them. Step 5: Add a Title Give the graph a clear title: "HIV Positive Cases Detected in 2012 by Age Group".