
We read your photo as:
Write down the type of graph that would best represent this data.
ScanSolve AI Answer
Step-by-step solution
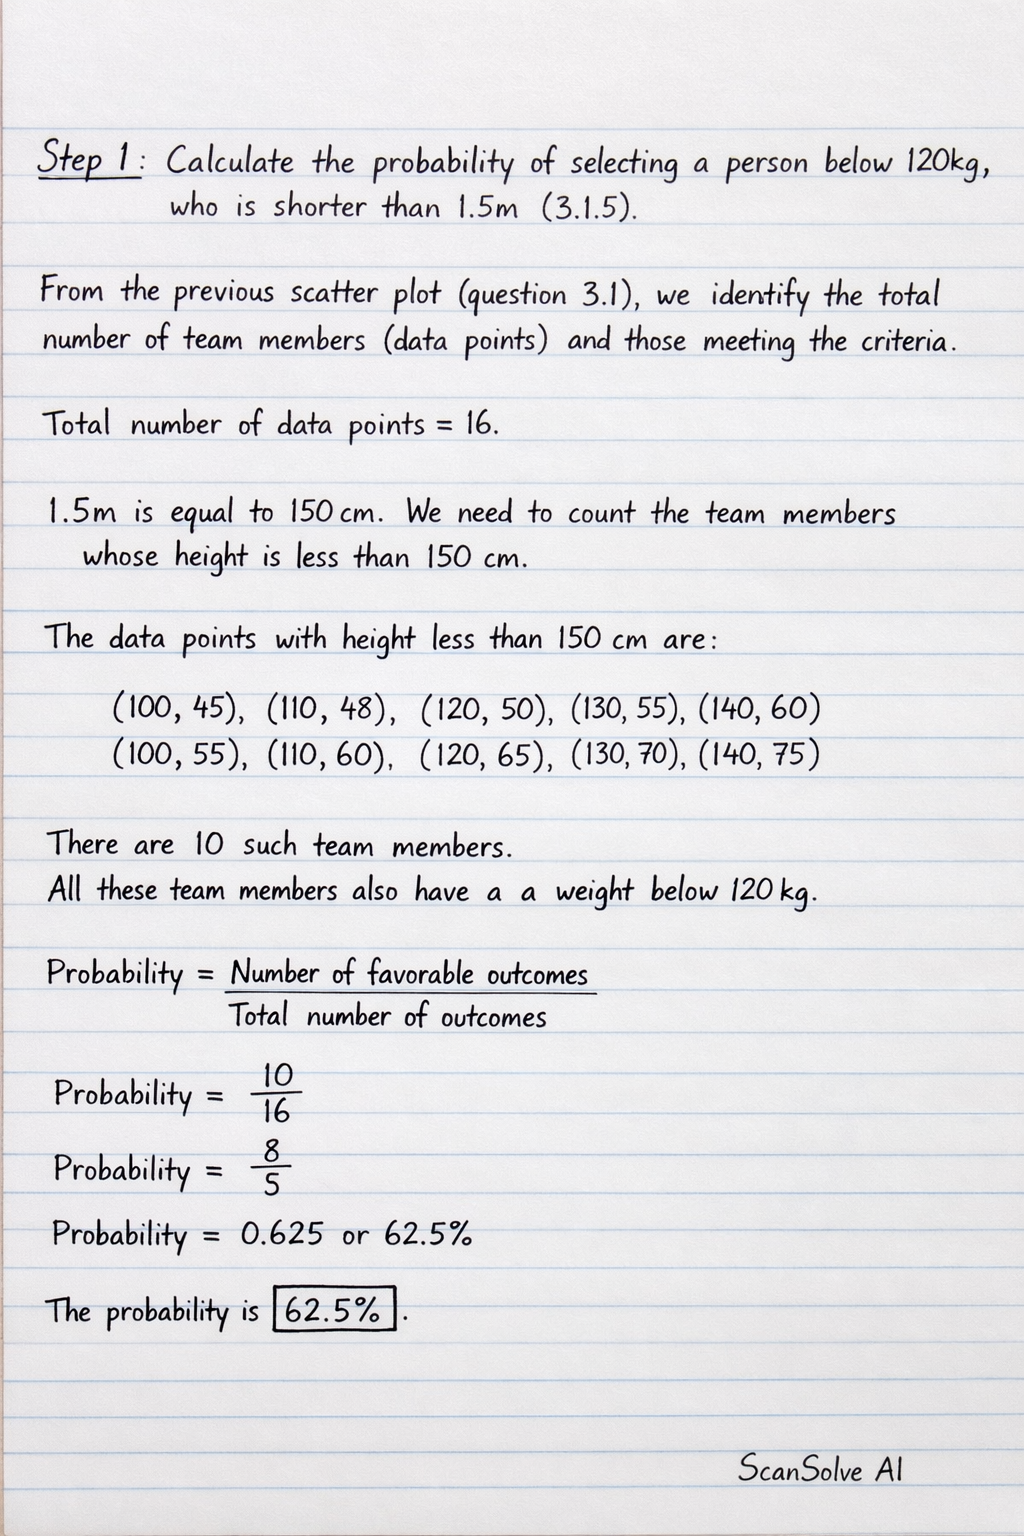
8 stepsCalculate the probability of selecting a person below 120kg, who is shorter than 1.5m (3.1.5).
From the previous scatter plot (question 3.1), we identify the total number of team members (data points) and those meeting the criteria.
Total number of data points = 16.
1.5m is equal to 150 cm. We need to count the team members whose height is less than 150 cm.
The data points with height less than 150 cm are:
(100, 45), (110, 48), (120, 50), (130, 55), (140, 60)
(100, 55), (110, 60), (120, 65), (130, 70), (140, 75)
There are 10 such team members. All these team members also have a weight below 120 kg.The probability is .
Give the BMI for someone who is overweight (3.1.6).
According to standard health guidelines, a person is considered overweight if their Body Mass Index (BMI) is between 25.0 and 29.9.
The BMI for someone who is overweight is .Write down the type of graph that would best represent the data in TABLE 4 (3.2.1).
The data in TABLE 4 shows the mass of recyclable material collected by learners from different classes. To compare the distribution, central tendency, and spread of data for each class, a box-and-whisker plot (or box plot) would be most suitable.
The type of graph is a .Calculate the missing mass P for Class 12A (3.2.2).
The mean mass collected by learners in Class 12A was 42 kg. There are 12 learners in Class 12A.
The masses are: 32, 45, 40, 38, 50, P, 36, 52, 40, 40, 36, 42.
The formula for the mean is:Calculate the IQR of Class 12B (3.2.3).
Class 12B data: 38, 46, 41, 52, 43, 40, 55, 45, 49, 51, 47, 39.
First, sort the data in ascending order:
38, 39, 40, 41, 43, 45, 46, 47, 49, 51, 52, 55.
There are 12 data points ().
The median (Q2) is between the 6th and 7th values: .
Q1 (First Quartile) is the median of the lower half of the data (the first 6 values): 38, 39, 40, 41, 43, 45.Q3 (Third Quartile) is the median of the upper half of the data (the last 6 values): 46, 47, 49, 51, 52, 55.
The Interquartile Range (IQR) is .
State whether the recycling coordinator's claim is valid (3.2.4).
The claim is that Class 12B performed better than Class 12C. We compare their performance using measures of central tendency (mean or median).
Class 12B:
Sorted data: 38, 39, 40, 41, 43, 45, 46, 47, 49, 51, 52, 55.
Sum of masses = 546 kg.
Mean of 12B = .
Median of 12B = .Class 12C:
Data: 42, 35, 48, 50, 46, 44, 39, 51, 45, 40, 37, 41.
Sorted data: 35, 37, 39, 40, 41, 42, 44, 45, 46, 48, 50, 51.
Sum of masses = 518 kg.
Mean of 12C = .
Median of 12C = .Since the mean of Class 12B (45.5 kg) is higher than the mean of Class 12C (43.17 kg), and the median of Class 12B (45.5 kg) is higher than the median of Class 12C (43 kg), Class 12B performed better on average.
The claim is .Write down as a percentage the probability of randomly selecting a learner whose collected mass is between 37 and 42 in Class 12B (3.2.5).
Class 12B sorted data: 38, 39, 40, 41, 43, 45, 46, 47, 49, 51, 52, 55.
"Between 37 and 42" means values greater than 37 and less than 42.
The masses in Class 12B that fit this criterion are: 38, 39, 40, 41.
There are 4 such learners.
Total learners in Class 12B = 12.As a percentage:
The probability is .
Write down the modal mass collected by learners in Class 12C (3.2.6).
Class 12C data: 42, 35, 48, 50, 46, 44, 39, 51, 45, 40, 37, 41.
Sorted data: 35, 37, 39, 40, 41, 42, 44, 45, 46, 48, 50, 51.
The mode is the value that appears most frequently in a data set. In this data set, each value appears only once.
Therefore, there is .
Still stuck on this one?
Ask a follow-up, and the answer starts from this question.
More Mathematics Questions
Handwritten Step-by-Step Solution
Get this as a handwritten image on WhatsApp — like a tutor wrote it for you.
Try on WhatsApp