
We read your photo as:
Graph the following functions and determine their intersection points: y = x² + 2x − 3 and y = -x² + 4x + 1.
Mathematics
ScanSolve AI Answer
✅ Correct.
The graph you've drawn accurately represents the function .
- The points from the table in part a) are correctly plotted.
- The x-intercepts are at and , matching the solutions from part c).
- The y-intercept is at .
- The minimum point (vertex) is correctly shown at approximately , consistent with the calculation in part b).
Was this helpful?
Still stuck on this one?
Ask a follow-up, and the answer starts from this question.
Got a different question?Ask your own question
More Mathematics Questions
QGraph the quadratic function y = −x2+4x+1. Find the vertex, y-intercept, and x-intercepts.QSketch the graph of the functions f(x)=x2 and g(x)=x+2. 2. Find the area between the curves y=x2 and…QSketch the graph of the quadratic function y = −x2+4x+1, identifying its vertex, y-intercept, and…QSketch the graph of the function y = x3 - 2x2 - 3x. Find the intercepts and turning points.QCalculate the points of intersection of 2y = 8x − 2x2 and 2y = 2x. Make a neat sketch of the graphs…
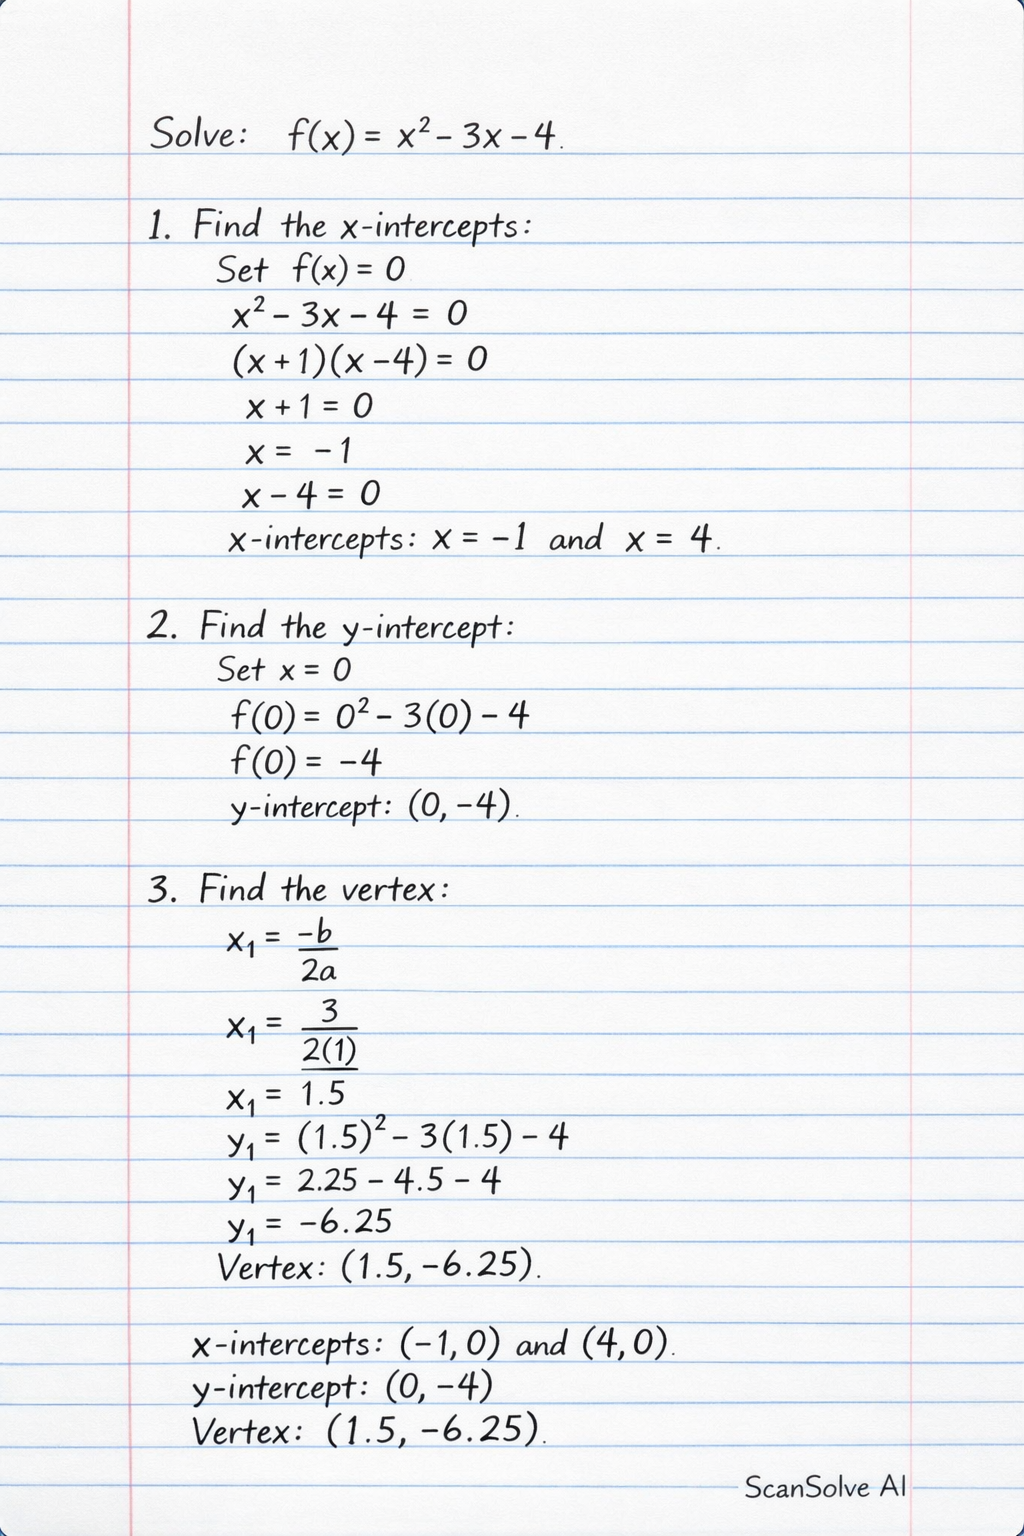
Handwritten Step-by-Step Solution
Get this as a handwritten image on WhatsApp — like a tutor wrote it for you.
Try on WhatsApp