
We read your photo as:
Graph the inequality y 2x - 2.
ScanSolve AI Answer
Use the left and right arrow keys to trace the curve, up and down to jump between key points, and plus and minus to zoom.
| Point | x | y |
|---|---|---|
| y-intercept | 0 | −2 |
| x-intercept | 1 | 0 |
Step-by-step solution
4 stepsThe problem you provided in the image is "Represent the inequality graphically." As discussed previously, is an equation of a line, not an inequality. For an equation, the solution is just the line itself, and no shading is involved.
However, if you meant to represent an inequality such as , , , or , then shading would be required.
Let's assume you meant the inequality , as your graph shows a solid line, which is used for "greater than or equal to" () or "less than or equal to" ().
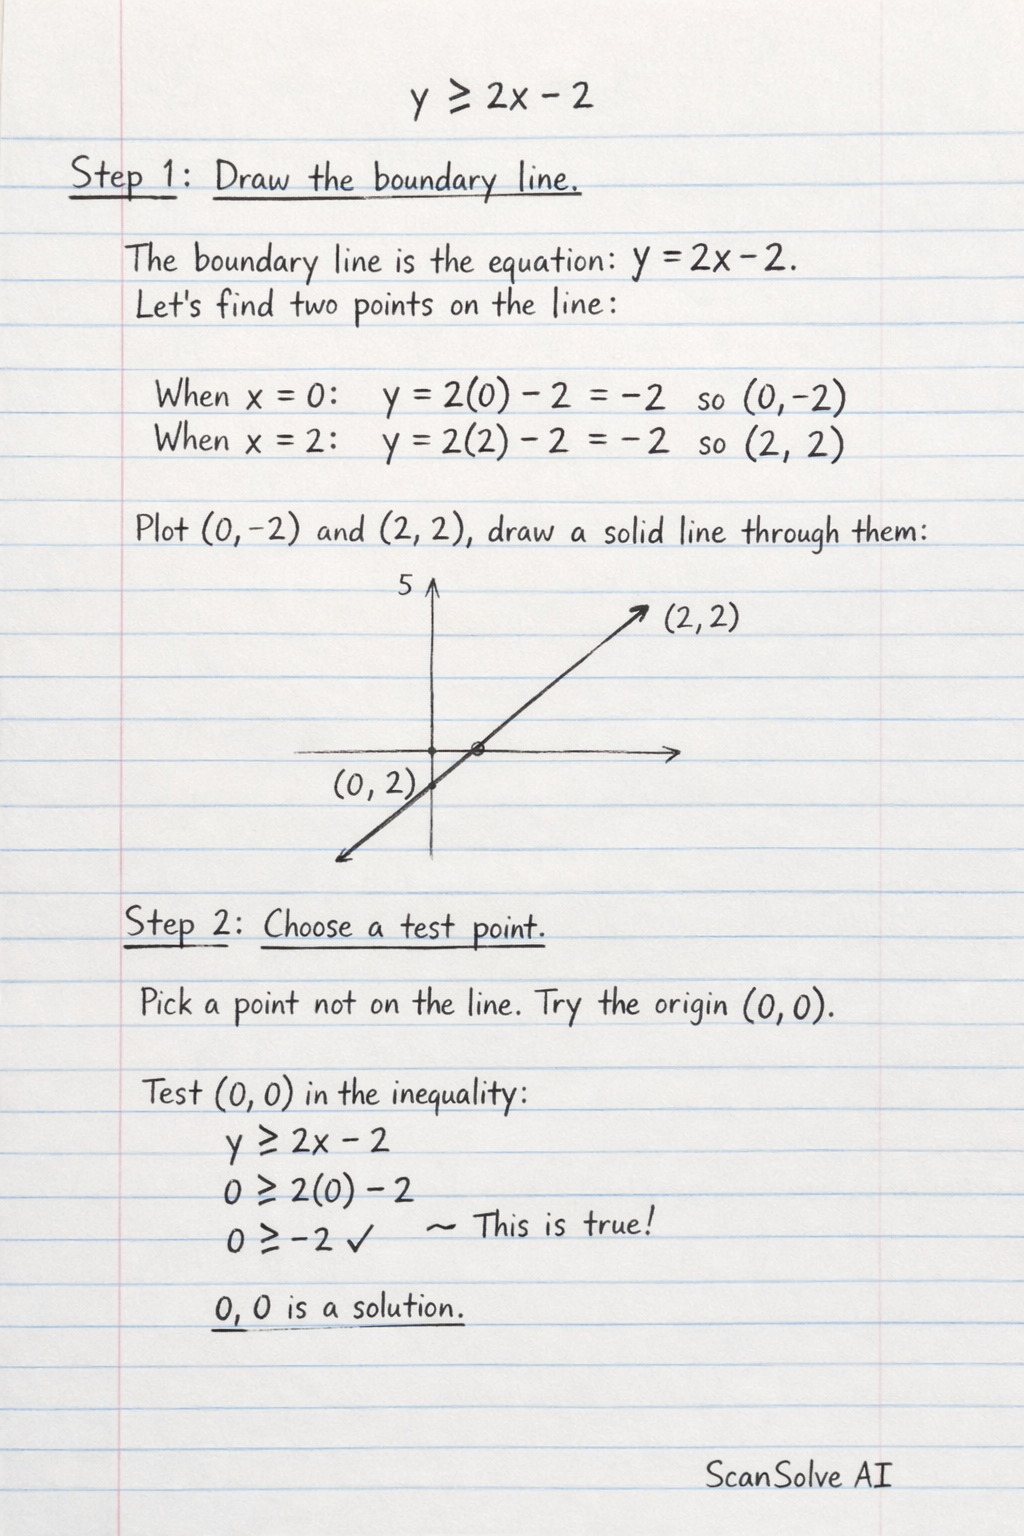
Draw the boundary line.
The boundary line is . You have already correctly drawn this line. Since the inequality is , the line should be solid (continuous), which matches your drawing.
Choose a test point.
Pick a point that is not on the line. The easiest point to use is often the origin $(0, 0)$.
Substitute the test point into the inequality.
Substitute and into the inequality :
Determine the shaded region.
The statement is true.
Since the test point satisfies the inequality, and is located above the line (relative to the y-intercept at ), you should shade the region above the line.- If the inequality were , you would shade the region above the solid line.
- If the inequality were , you would shade the region below the solid line.
- If the inequality were , you would draw a dashed line and shade the region above it.
- If the inequality were , you would draw a dashed line and shade the region below it.
For the inequality , you should shade the region above the line .
Still stuck on this one?
Ask a follow-up, and the answer starts from this question.
More Mathematics Questions
Handwritten Step-by-Step Solution
Get this as a handwritten image on WhatsApp — like a tutor wrote it for you.
Try on WhatsApp