
We read your photo as:
Graphs of two functions are shown. What is the value of f(2) + g(2)?
Mathematics
ScanSolve AI Answer
Answer
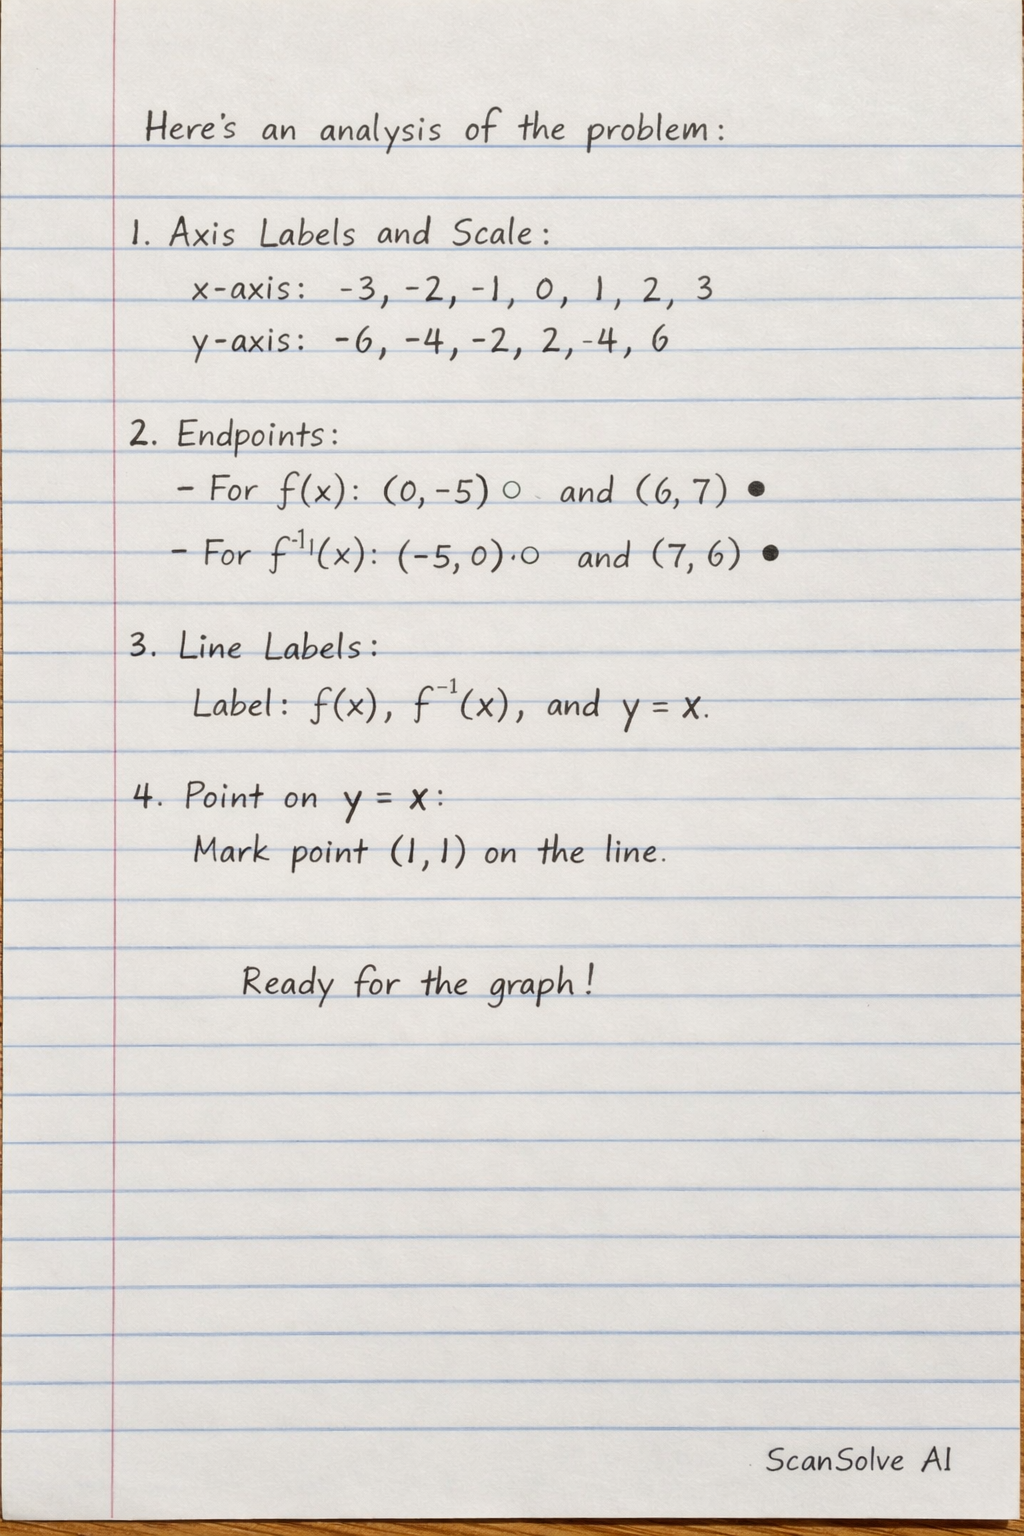
You've made a good start on the graph, sthamntungwa! The general shape and reflection across the line are visible.
Here's some feedback to make it perfect:
- Axis Labels and Scale: Ensure your x and y axes are consistently numbered at regular intervals (e.g., 1, 2, 3, ... for each major grid line). This makes it easier to read specific points.
- Endpoints: Clearly mark the endpoints of each line segment with either an open circle (for points not included, like for and for ) or a closed circle (for points included, like for and for ).
- Line Labels: Label each line directly on the graph: , , and .
- Point on : You've drawn correctly through the origin. You can also explicitly mark another point on it, like , as requested in the original question.
The lines themselves appear to be in the correct positions relative to each other and the line . Just refine the details for full marks!
Was this helpful?
Still stuck on this one?
Ask a follow-up, and the answer starts from this question.
Got a different question?Ask your own question
More Mathematics Questions
QIf g(x) = x + 1 and f(x + (1)/(x)) = x2 + (1)/(x2), what is f(g(2))?QThe functions f and g are defined by f(x) = 2x² and g(x) = (3x−2)/(x+1). Find fog(x).QGiven f g(x) = (x+2)/(3) and g(x) = 2x+5.QTo sketch the graphs of f(x) = x2 - 4 and g(x) = −2x − 4:QSECTION A: PURE MATHEMATICS Two functions f: G → R, g: G → R. Given that f(x) = x2 – 1 and g(x) = 2x…
Handwritten Step-by-Step Solution
Get this as a handwritten image on WhatsApp — like a tutor wrote it for you.
Try on WhatsApp