
We read your photo as:
Identify the final time value on the x-axis.
ScanSolve AI Answer
Answers
4 partsStep-by-step solution
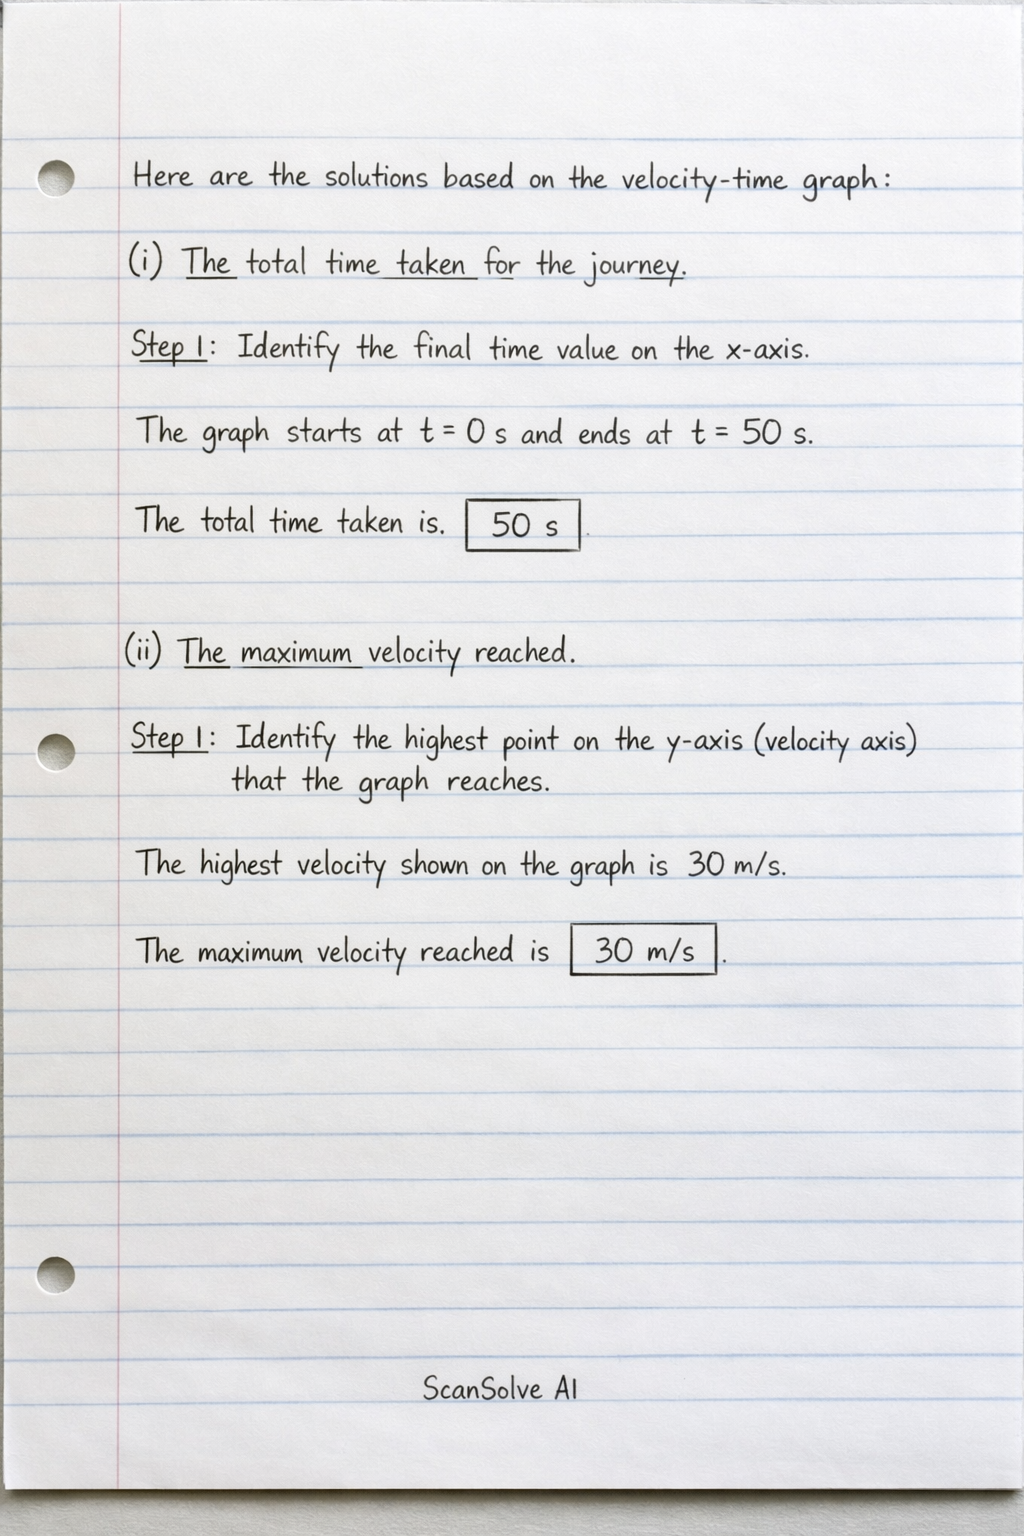
8 stepsHere are the solutions based on the velocity-time graph:
Part i· 1 step
**The total time taken for the journey.
Identify the final time value on the x-axis.
The graph starts at s and ends at s.
The total time taken is .
Part ii
**The maximum velocity reached.
Identify the highest point on the y-axis (velocity axis) that the graph reaches.
The highest velocity shown on the graph is 30 m/s.
The maximum velocity reached is .
Part iii
**The acceleration during the first 20 seconds.
Recall that acceleration is the gradient of a velocity-time graph.
The acceleration is given by the formula .
Identify the initial and final velocities and times for the first 20 seconds.
Initial velocity () at s is 0 m/s.
Final velocity () at s is 30 m/s.Substitute the values into the formula and calculate.
The acceleration during the first 20 seconds is .
Part iv
**The total distance travelled.
Recall that the total distance travelled is the area under the velocity-time graph.
The shape under the graph is a trapezoid. The area of a trapezoid is given by , where and are the lengths of the parallel sides and is the height.
Identify the lengths of the parallel sides and the height from the graph.
The parallel sides are the time intervals where the velocity is non-zero.
Length of the top parallel side (constant velocity section): .
Length of the bottom parallel side (total time): .
The height of the trapezoid (maximum velocity) is 30 m/s.Substitute the values into the formula and calculate.
The total distance travelled is .
Try one yourself
A new problem that tests the same skill.
Still stuck on this one?
Ask a follow-up, and the answer starts from this question.
More Mathematics Questions
Handwritten Step-by-Step Solution
Get this as a handwritten image on WhatsApp — like a tutor wrote it for you.
Try on WhatsApp