
We read your photo as:
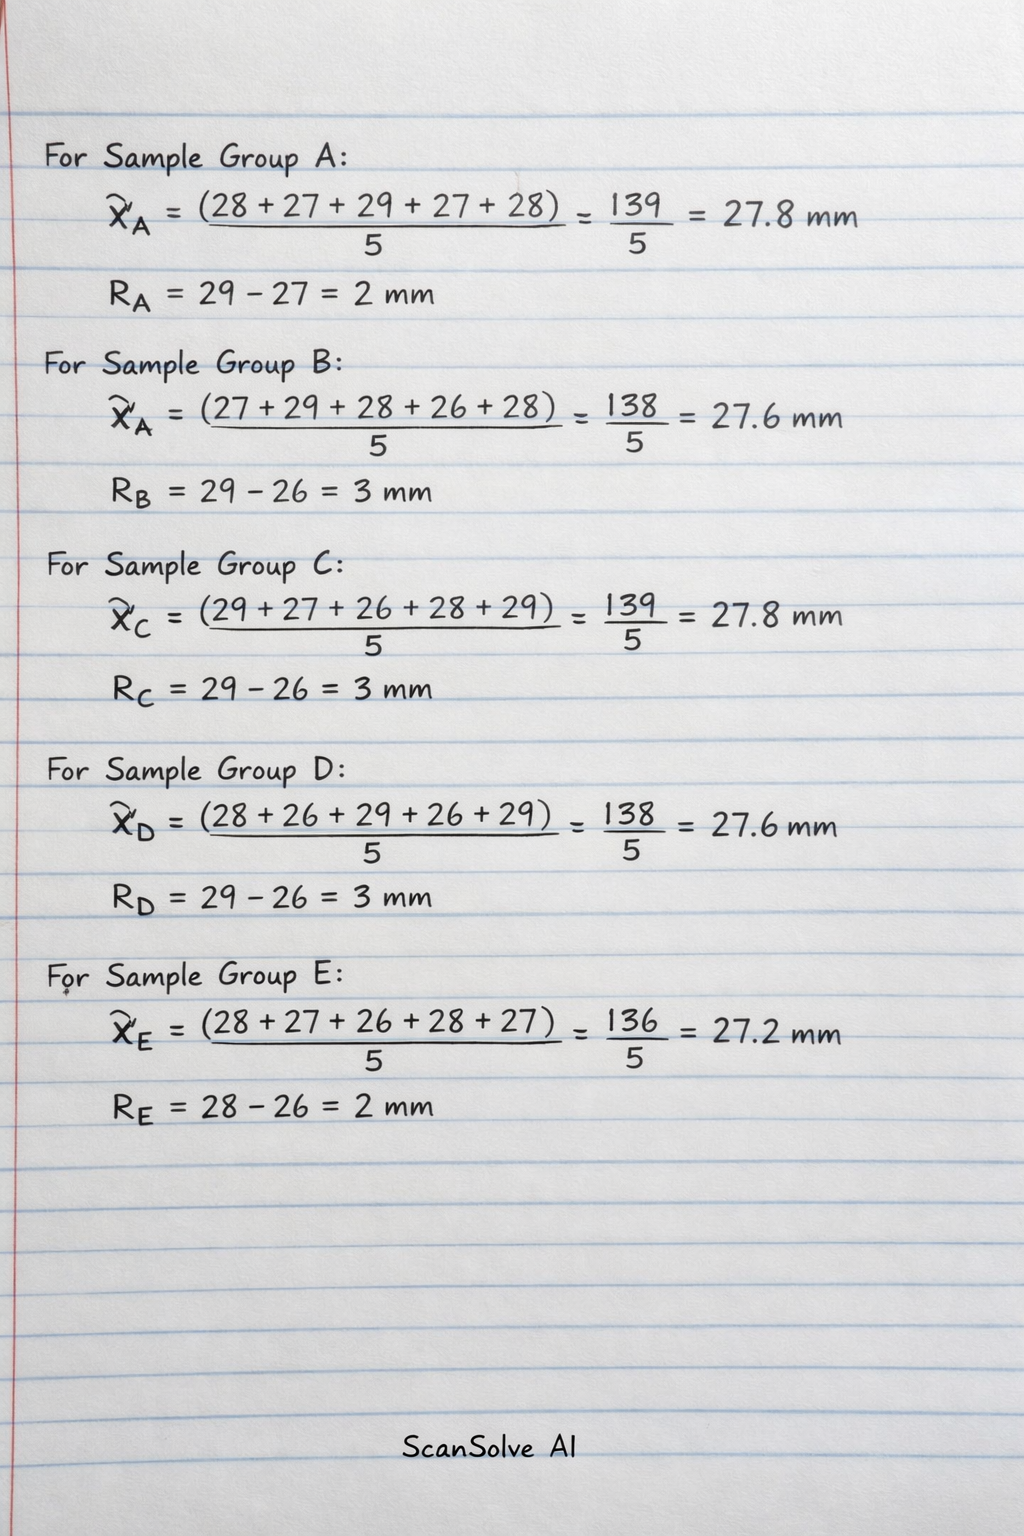
Calculate the mean (x) for each sample group by summing the lengths and dividing by the number of studs (5).
ScanSolve AI Answer
This answer stops before the end.
It was cut off when it was first written. Ask ScanSolve this question again for the full working.
here's the solution:
b) (i)
Step 1: Calculate the mean () for each sample group by summing the lengths and dividing by the number of studs (5).
Step 2: Calculate the range (R) for each sample group by subtracting the minimum length from the maximum length.
For Sample Group A:
For Sample Group B:
For Sample Group C:
For Sample Group D:
For Sample Group E:
b) (ii)
Step 1: Calculate the process mean () by averaging the means of all sample groups.
Step 2: Calculate the mean of sample ranges () by averaging the ranges of all sample groups.
Process mean:
Mean of sample ranges:
b) (iii)
Step 1: Calculate the process standard deviation () using the formula .
Step 2: Calculate the standard error of the mean, , where is the sample size.
Step 3: Determine the warning and action lines for the mean chart using the formulas:
Center Line (CL) =
Upper Warning Line (UWL) =
Lower Warning Line (LWL) =
Upper Action Line (UAL) =
Lower Action Line (LAL) =
Given Hartley's constant, .
Process standard deviation:
Standard error of the mean:
Center Line (CL):
Warning Lines:
Still stuck on this one?
Ask a follow-up, and the answer starts from this question.
More Mathematics Questions
Handwritten Step-by-Step Solution
Get this as a handwritten image on WhatsApp — like a tutor wrote it for you.
Try on WhatsApp