This mathematics problem involves applying core mathematical principles and formulas. Below you will find a complete step-by-step solution with detailed explanations for each step, helping you understand not just the answer but the method behind it.

ScanSolve AI Answer
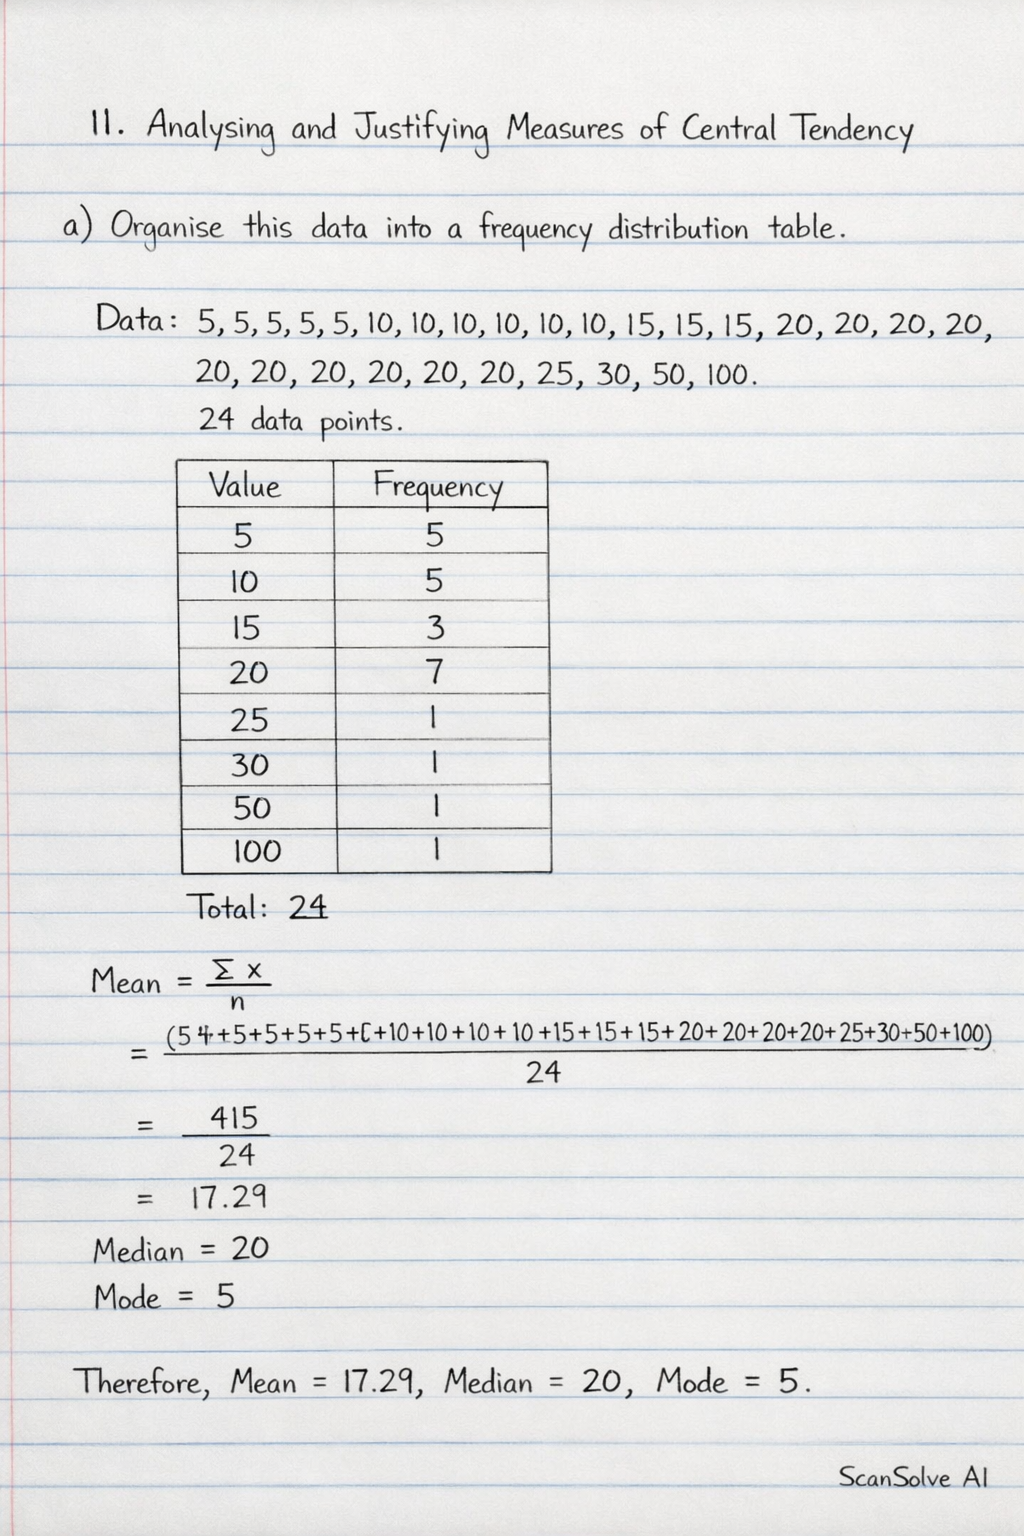
Here are the solutions to the questions:
11. Analysing and Justifying Measures of Central Tendency
a) Organise this data into a frequency distribution table. The given data is: 5, 5, 5, 5, 5, 10, 10, 10, 10, 10, 15, 15, 15, 20, 20, 20, 20, 20, 20, 20, 25, 30, 50, 100. There are 24 data points.
\begin{array}{|c|c|} \hlineGet instant step-by-step solutions to any question. Free to start.
Ask Your Question
Handwritten Step-by-Step Solution
Get this as a handwritten image on WhatsApp — like a tutor wrote it for you.
Try on WhatsAppStill have questions?
11. Analysing and Justifying Measures of Central Tendency a) Organise this data into a frequency distribution table.
This mathematics problem involves applying core mathematical principles and formulas. Below you will find a complete step-by-step solution with detailed explanations for each step, helping you understand not just the answer but the method behind it.