
We read your photo as:
Plot the ordered pairs (x, y) for all three equations. Use a ruler to draw a solid line through the points for each equation. Use a different colour or line style (e.g. solid, dashed, dotted) for each line. Label the lines: Equation 1, Equation 2, and Equation 3.
Mathematics
ScanSolve AI Answer
Step-by-step solution
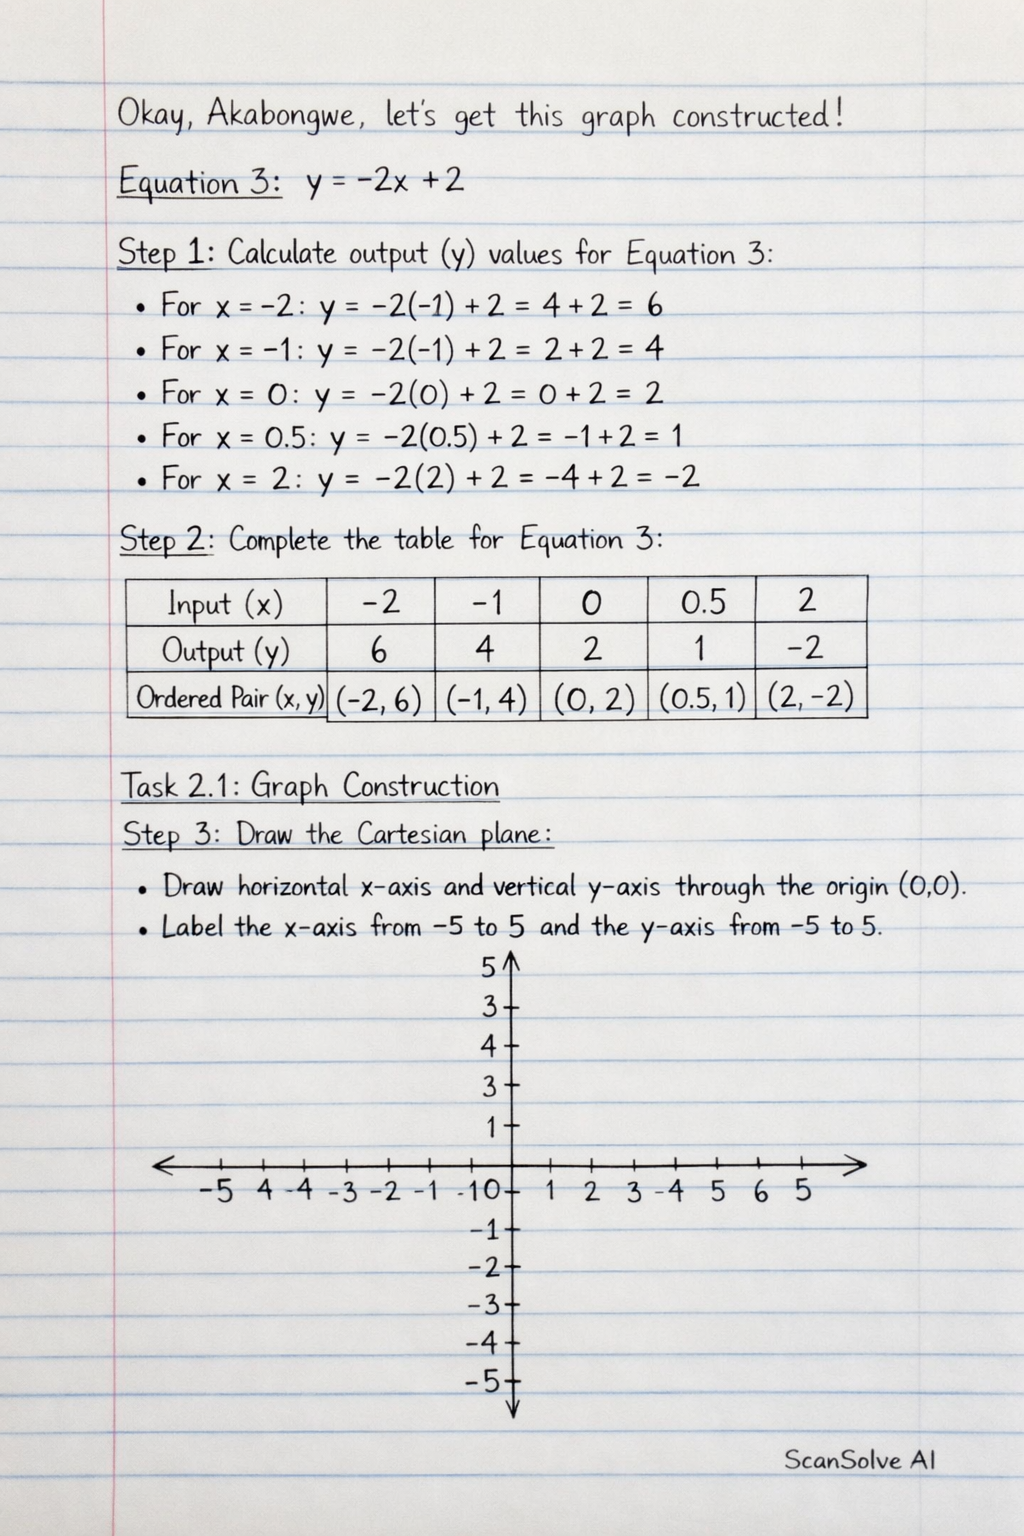
5 stepsOkay, Akabongwe, let's get this graph constructed!
Equation 3:
Calculate output (y) values for Equation 3.
- For :
- For :
- For :
- For :
- For :
Complete the table for Equation 3.
Task 2.1: Graph Construction
Draw the Cartesian plane.
- On your graph paper, draw a horizontal x-axis and a vertical y-axis that intersect at the origin (0,0).
- Label the x-axis from -5 to 5 and the y-axis from -5 to 5, marking integer values clearly.
Plot the ordered pairs for all three equations.
- For Equation 1 (): Plot , , , , . All these points are within the specified range.
- For Equation 2 (): Plot , , . Note that and fall outside the y-axis range of -5 to 5, so they cannot be plotted on this specific graph.
- For Equation 3 (): Plot , , , . Note that falls outside the y-axis range of -5 to 5, so it cannot be plotted on this specific graph.
Draw and label the lines.
- Using a ruler, draw a solid line through the plotted points for Equation 1. Label this line "Equation 1".
- Using a ruler, draw a solid line through the plotted points for Equation 2. Use a different color or line style (e.g., dashed) for this line. Label it "Equation 2".
- Using a ruler, draw a solid line through the plotted points for Equation 3. Use a third different color or line style (e.g., dotted) for this line. Label it "Equation 3".
Was this helpful?
Still stuck on this one?
Ask a follow-up, and the answer starts from this question.
Got a different question?Ask your own question
More Mathematics Questions
QComplete the tables below by determining the values for each equation. Plot each point (x, y) on the…QDraw the graph of each of the equations given below and also find the coordinate axes. i) 6x − 3y…QHow do I graph the equations y = −2x + 3 and x + y = 5 using points?QHow do you draw the straight line graphs for the equations y = −2x + 3 and x + y = 5?QGraph the following linear equations by finding two points for each: a) y = −2x + 3 b) x + y = 5
Handwritten Step-by-Step Solution
Get this as a handwritten image on WhatsApp — like a tutor wrote it for you.
Try on WhatsApp