

This mathematics problem involves applying core mathematical principles and formulas. Below you will find a complete step-by-step solution with detailed explanations for each step, helping you understand not just the answer but the method behind it.
ScanSolve AI Answer
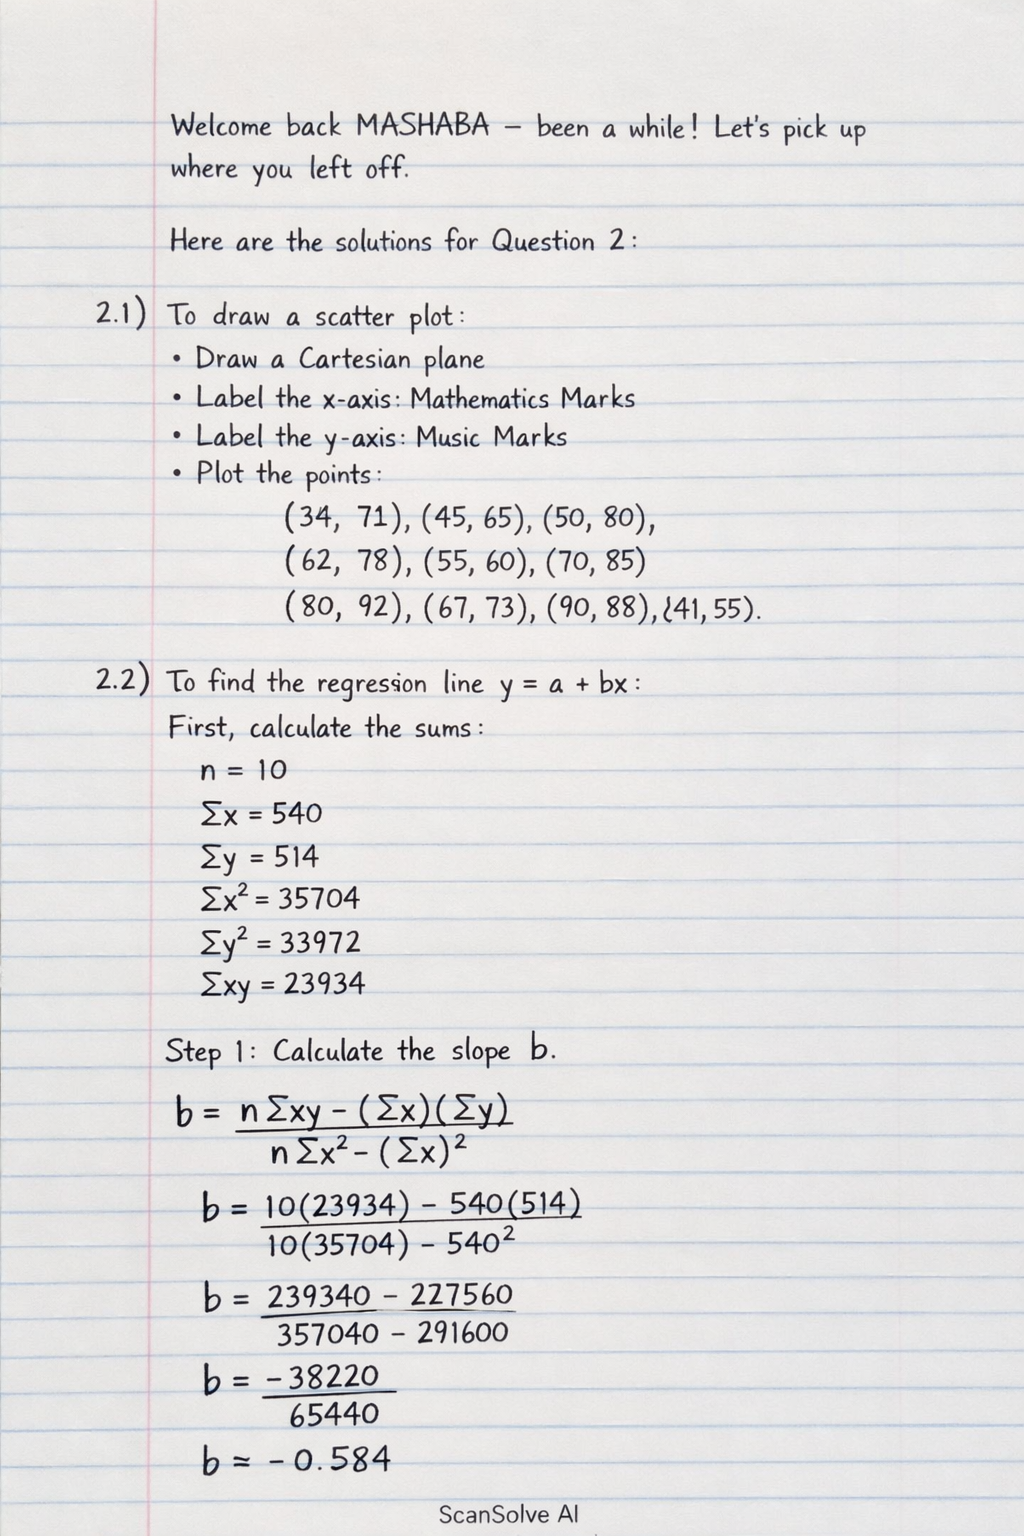
2.1 To draw a scatter plot: • Draw a Cartesian plane with the horizontal axis representing "Mathematics Marks" and the vertical axis representing "Music Marks". • Label both axes from 0 to 100 with appropriate increments. • Plot each pair of marks (x, y) as a point on the graph. For example, the first point would be (34, 71). 2.2 To determine the equation of the regression line y = a + bx, we first calculate the necessary sums from the given data: n = 10 x = 540 y = 514 x^2 = 35704 y^2 = 33972 xy = 23934 Step 1: Calculate the slope b. b = (n xy - ( x)( y))/(n x^2 - ( x)^2) b = (10(23934) - (540)(514))/(10(35704) - (540)^2) b = (239340 - 277560)/(357040 - 291600) b = (-38220)/(65440) ≈ -0.584 Step 2: Calculate the y-intercept a. First, find the means: x = (540)/(10) = 54 and y = (514)/(10) = 51.4. a = y - bx a = 51.4 - (-0.584046...)(54) a = 51.4 + 31.5385... ≈ 82.939 Step 3: Write the equation of the regression line. y = 82.939 - 0.584x The equation of the regression line is y = 82.939 - 0.584x. 2.3 To determine the correlation coefficient r: r = (n xy - ( x)( y))/(sqrt([n x^2 - ( x)^2][n y^2 - ( y)^2])) Step 1: Use the previously calculated numerator and the first part of the denominator. Numerator: n xy - ( x)( y) = -38220 Denominator part 1: n x^2 - ( x)^2 = 65440 Step 2: Calculate the second part of the denominator. n y^2 - ( y)^2 = 10(33972) - (514)^2 = 339720 - 264196 = 75524 Step 3: Calculate r. r = (-38220)/(sqrt((65440)(75524))) r = (-38220)/(sqrt(4939769760)) r = (-38220)/(70283.509...) ≈ -0.544 The correlation coefficient is -0.544. 2.4 The correlation coefficient r = -0.544 indicates a moderate negative linear correlation between Mathematics marks and Music marks. This means that as a learner's Mathematics mark increases, their Music mark tends to decrease, but the relationship is not very strong. 2.5 An outlier is a data point that significantly deviates from the general trend of the other data points. Looking at the data, most points show a negative relationship (high in one subject, low in the other). However, the point (90, 89) represents a learner who scored high in both Mathematics (90) and Music (89), which goes against the observed negative trend. The outlier in the set of data is (90, 89). Send me the next one 📸