
We read your photo as:
Sketch the graph of the rational function y = rac(x+2)(x−2)(x+1) using vertical and horizontal asymptotes, intercepts, and interval testing.
ScanSolve AI Answer
Answer
Step-by-step solution
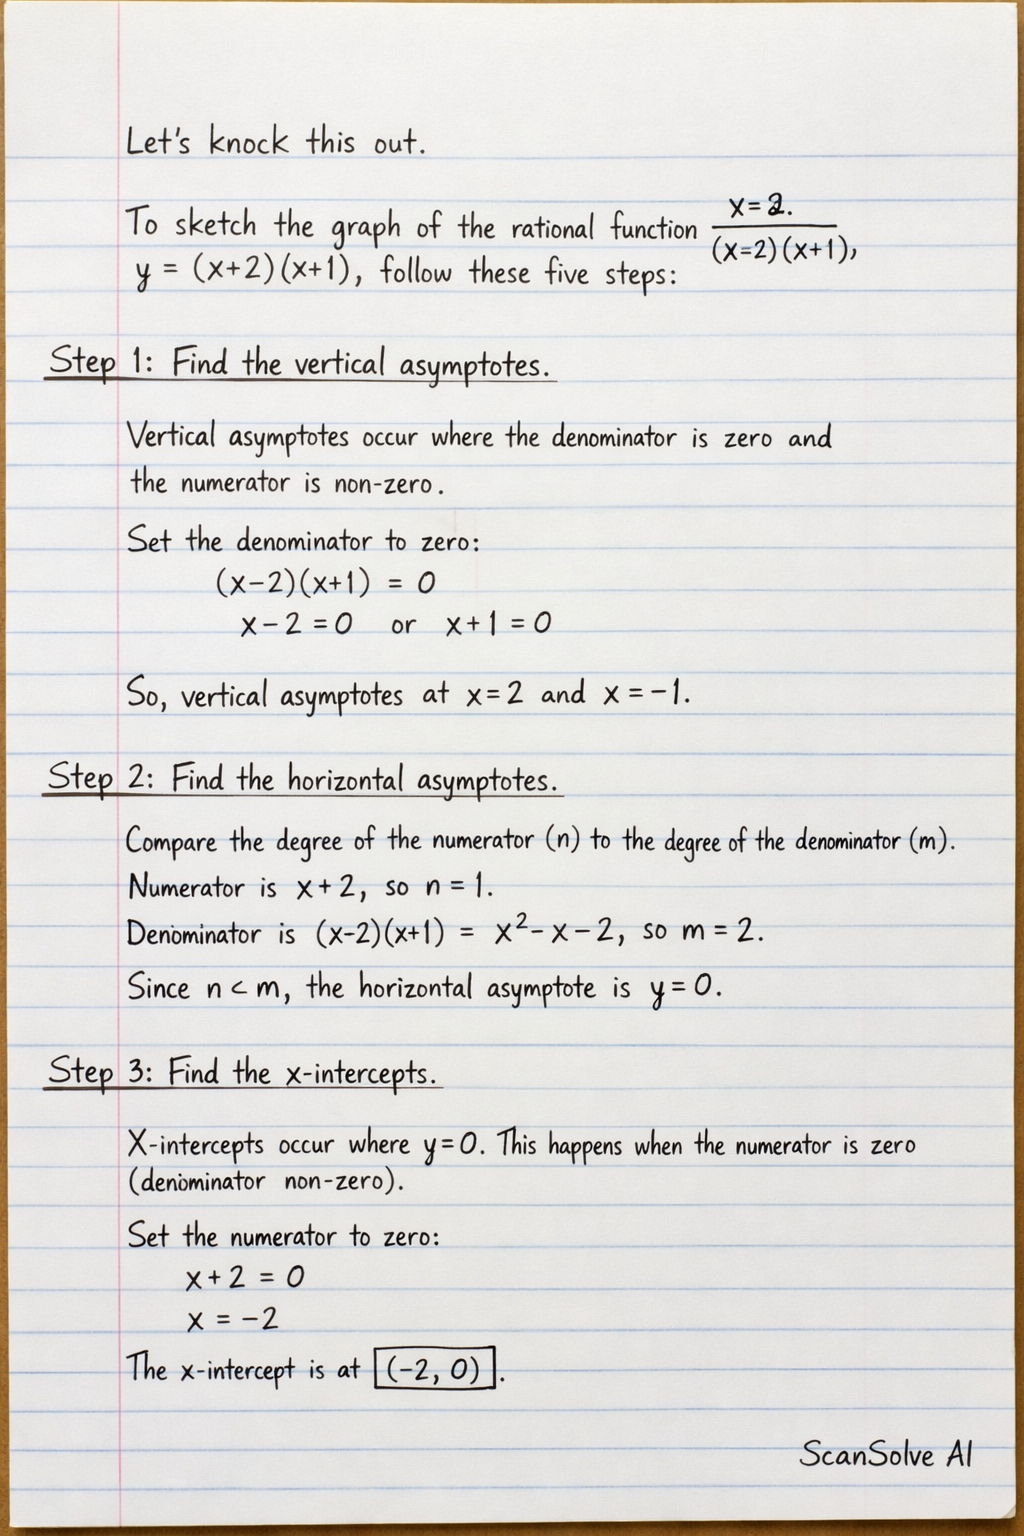
5 stepsLet's knock this out.
To sketch the graph of the rational function , follow these five steps:
Find the vertical asymptotes.
Vertical asymptotes occur where the denominator is zero and the numerator is non-zero.
Set the denominator to zero:This gives or .
Therefore, the vertical asymptotes are at and .Find the horizontal asymptotes.
Compare the degree of the numerator () to the degree of the denominator ().
The numerator is , so its degree is .
The denominator is , so its degree is .
Since , the horizontal asymptote is .Find the x-intercepts.
X-intercepts occur where . This happens when the numerator is zero (and the denominator is non-zero).
Set the numerator to zero:The x-intercept is at .
Find the y-intercepts.
Y-intercepts occur where . Substitute into the function:
The y-intercept is at .
Determine the behavior of the graph in intervals.
Use the x-intercept () and vertical asymptotes () to divide the x-axis into intervals: , , , . Test a point in each interval to determine the sign of .
- For (e.g., ): . The graph is below the x-axis.
- For (e.g., ): . The graph is above the x-axis.
- For (e.g., ): . The graph is below the x-axis.
- For (e.g., ): . The graph is above the x-axis.
These points and behaviors allow you to sketch the curve, approaching the asymptotes and passing through the intercepts.
Try one yourself
A new problem that tests the same skill.
Still stuck on this one?
Ask a follow-up, and the answer starts from this question.
More Mathematics Questions
Handwritten Step-by-Step Solution
Get this as a handwritten image on WhatsApp — like a tutor wrote it for you.
Try on WhatsApp