
We read your photo as:
Sketch the graph of trigonometry.you sketch it
ScanSolve AI Answer
Step-by-step solution
6 stepsYou're asking for a visual representation of the graphs. Since I can't draw images directly, I'll provide a detailed description of how to sketch each graph based on the calculations we just did.
Part a· 3 steps
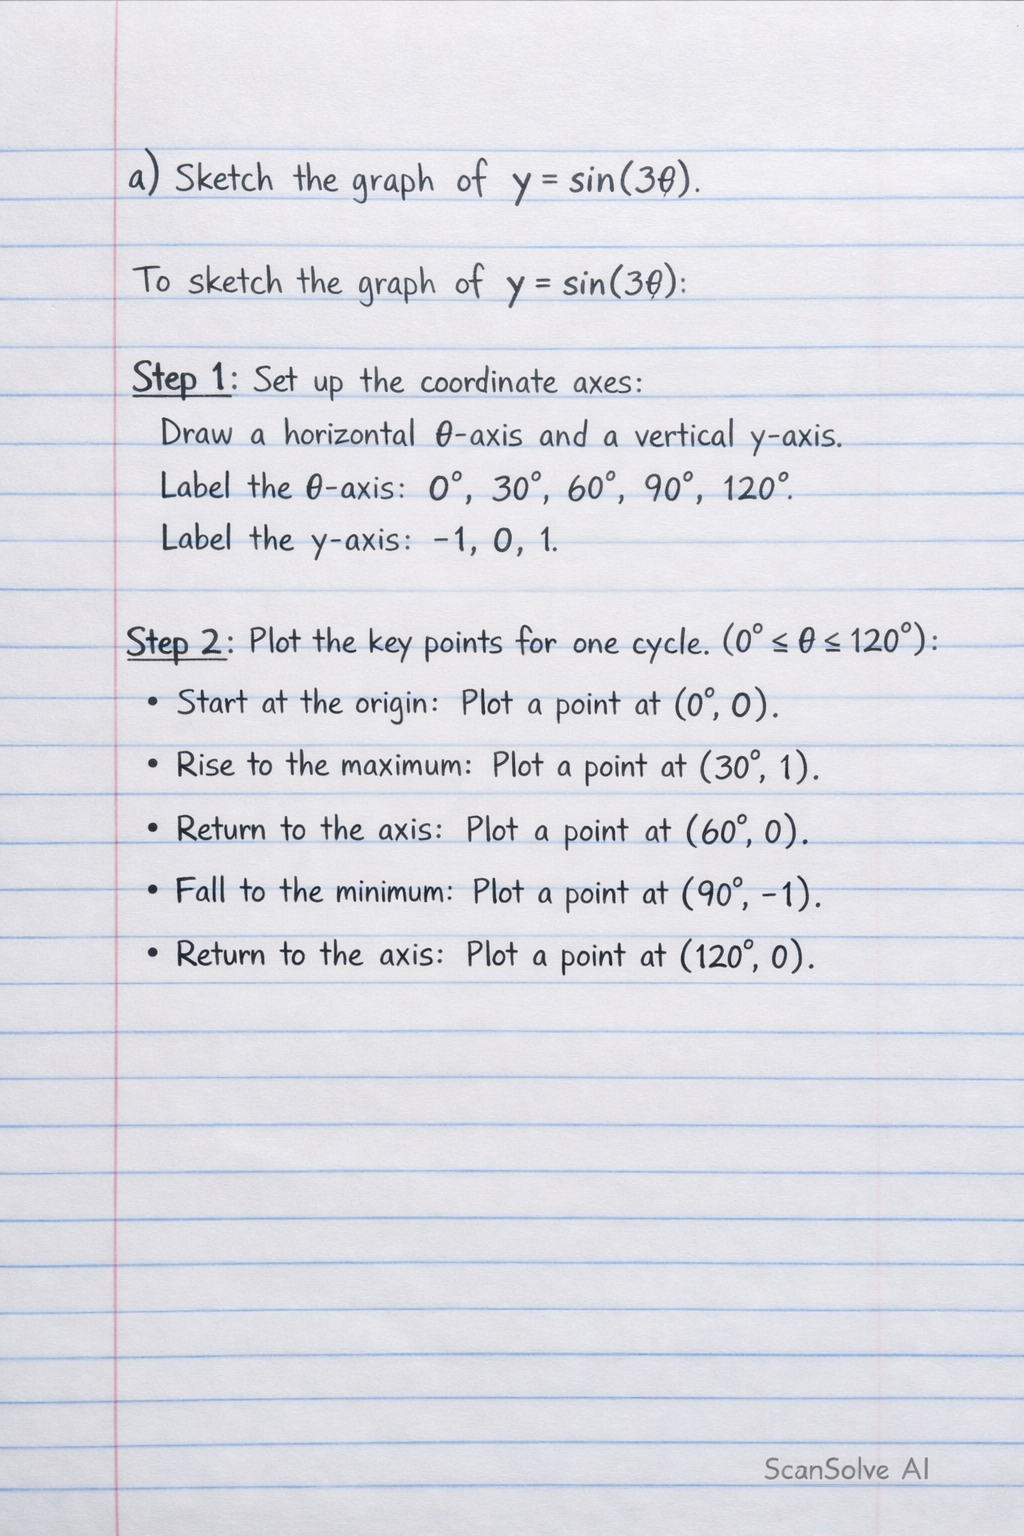
Sketch the graph of .
To sketch the graph of :
Set up the coordinate axes.
Draw a horizontal axis for and a vertical axis for .
Label the -axis with increments of (e.g., ).
Label the -axis with values from -1 to 1 (e.g., -1, 0, 1).Plot the key points for one cycle ().
- Start at the origin: Plot a point at .
- Rise to the maximum: Plot a point at .
- Return to the axis: Plot a point at .
- Fall to the minimum: Plot a point at .
- Return to the axis: Plot a point at .
Draw the curve.
Connect these plotted points with a smooth, wave-like curve. The curve should start at , go up to , come down through , continue down to , and then rise back up to . This completes one full cycle of the sine wave.
Part b· 3 steps
Sketch the graph of .
To sketch the graph of :
Set up the coordinate axes.
Draw a horizontal axis for and a vertical axis for .
Label the -axis with increments of (e.g., ).
Label the -axis with values from -1 to 1 (e.g., -1, 0, 1).Plot the key points for one cycle ().
- Start at the maximum: Plot a point at .
- Cross the axis: Plot a point at .
- Fall to the minimum: Plot a point at .
- Cross the axis: Plot a point at .
- Return to the maximum: Plot a point at .
Draw the curve.
Connect these plotted points with a smooth, wave-like curve. The curve should start at , go down through , continue down to , then rise through , and finally go up to . This completes one full cycle of the cosine wave.
Still stuck on this one?
Ask a follow-up, and the answer starts from this question.
More Mathematics Questions
Handwritten Step-by-Step Solution
Get this as a handwritten image on WhatsApp — like a tutor wrote it for you.
Try on WhatsApp