
We read your photo as:
The relation is given by y = 7x + c. A table of (x, y) pairs is provided, with some values missing. (a) Find the value of c. (b) Complete the table. (c) Draw the graph of the relation, using a scale o
ScanSolve AI Answer
Step-by-step solution
8 stepsLet's solve question 4. The relation is given by .
a)
Use one of the complete pairs from the table to find the value of .
Let's use the pair .
Substitute and into the equation .Solve for .
b)
Now that we know , the relation is . We will use this to complete the table.Calculate for .
Calculate for .
Calculate for .
Calculate for .
Calculate for .
The completed table is:
x: -2, -1, 0, 1, 2, 3, 4, 5
y: -19, * -12*, * -5*, 2, 9, 16, 23, 30c) (i)
This step requires drawing axes. As an AI, I cannot physically draw. You need to:- Draw two perpendicular lines on your graph sheet.
- Label the horizontal axis OX (x-axis) and the vertical axis OY (y-axis).
- Use a scale of 2 cm to represent 1 unit on the x-axis.
- Use a scale of 2 cm to represent 5 units on the y-axis.
c) (ii)
This step requires marking the axes. As an AI, I cannot physically mark axes. You need to:- Mark the x-axis from to 5.
- Mark the y-axis from to 35.
d)
This step requires plotting points and drawing a line. As an AI, I cannot physically perform this action. You need to:- Plot the ordered pairs from the completed table in part (b) on your graph sheet. The points are: .
- Join these plotted points with a straight line using a ruler.
e)
To find the value of when using the graph, you would locate on the x-axis, move vertically to the line you drew, and then move horizontally to the y-axis to read the corresponding value.
Using the equation for an exact calculation:
Still stuck on this one?
Ask a follow-up, and the answer starts from this question.
More Mathematics Questions
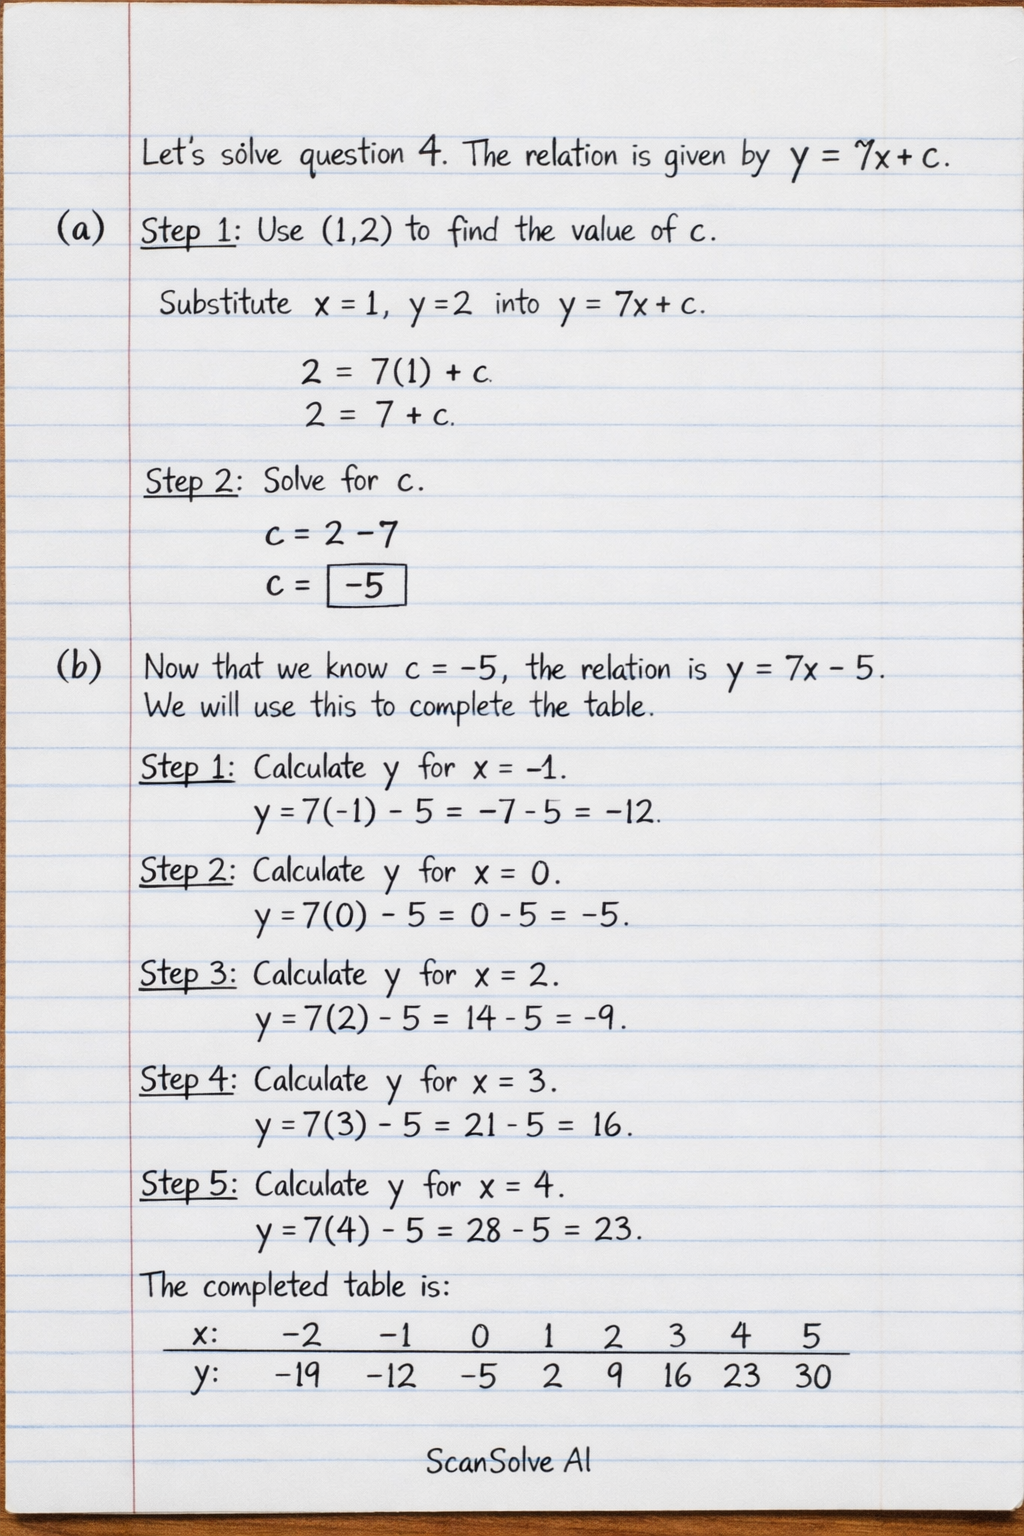
Handwritten Step-by-Step Solution
Get this as a handwritten image on WhatsApp — like a tutor wrote it for you.
Try on WhatsApp