
We read your photo as:
The table below represents a relationship between 2 variables Q and R connected by the equation Q=aR+b, where a and b are constant. On the grid provided draw the line of best fit for the data. Use your graph to find the value of b.
Mathematics
ScanSolve AI Answer
Answer
b
Huu hapa ni mwongozo wa kutatua swali hili:
a) Kuchora mstari wa best fit:
- Chora shoka mbili kwenye gridi uliyopewa: shoka ya mlalo (x-axis) kwa na shoka ya wima (y-axis) kwa .
- Weka mizani inayofaa kwa kila shoka. Kwa mfano, kwa , unaweza kutumia mizani kutoka 0 hadi 0.7. Kwa , unaweza kutumia mizani kutoka 0 hadi 7.
- Panga pointi zote zilizotolewa kwenye jedwali kwenye gridi yako:
- Chora mstari ulionyooka unaopita karibu na pointi zote iwezekanavyo. Hakikisha kuna idadi sawa ya pointi juu na chini ya mstari. Panua mstari huu hadi ukate shoka ya .
b) Kutafuta thamani ya kutoka kwenye grafu:
- Mlinganyo uliotolewa ni . Katika mlinganyo huu, inawakilisha Q-intercept (y-intercept), ambayo ni thamani ya wakati .
- Kutoka kwenye grafu uliyochora katika sehemu (a), soma thamani ya ambapo mstari wako wa best fit unakata shoka ya (yaani, ambapo ).
- Kutokana na data iliyotolewa, mstari wa best fit unapaswa kukata shoka ya karibu na 1.96.
Was this helpful?
Try one yourself
A new problem that tests the same skill.
Still stuck on this one?
Ask a follow-up, and the answer starts from this question.
Got a different question?Ask your own question
More Mathematics Questions
QGiven the expression I(R+a) = b, linearize it to plot a suitable graph, identify the variables for…QThe quantities P, Q and R are such that P varies directly as Q and inversely as the square root of…QSolve for P if P varies as the square of Q, and P=4 when Q=16. Find R if R varies inversely as the…QThe following equation for the variation of two quantities x and t, x=a+b where a and b are contant…Q2.1 Determine Q 10.2.2 Determine R
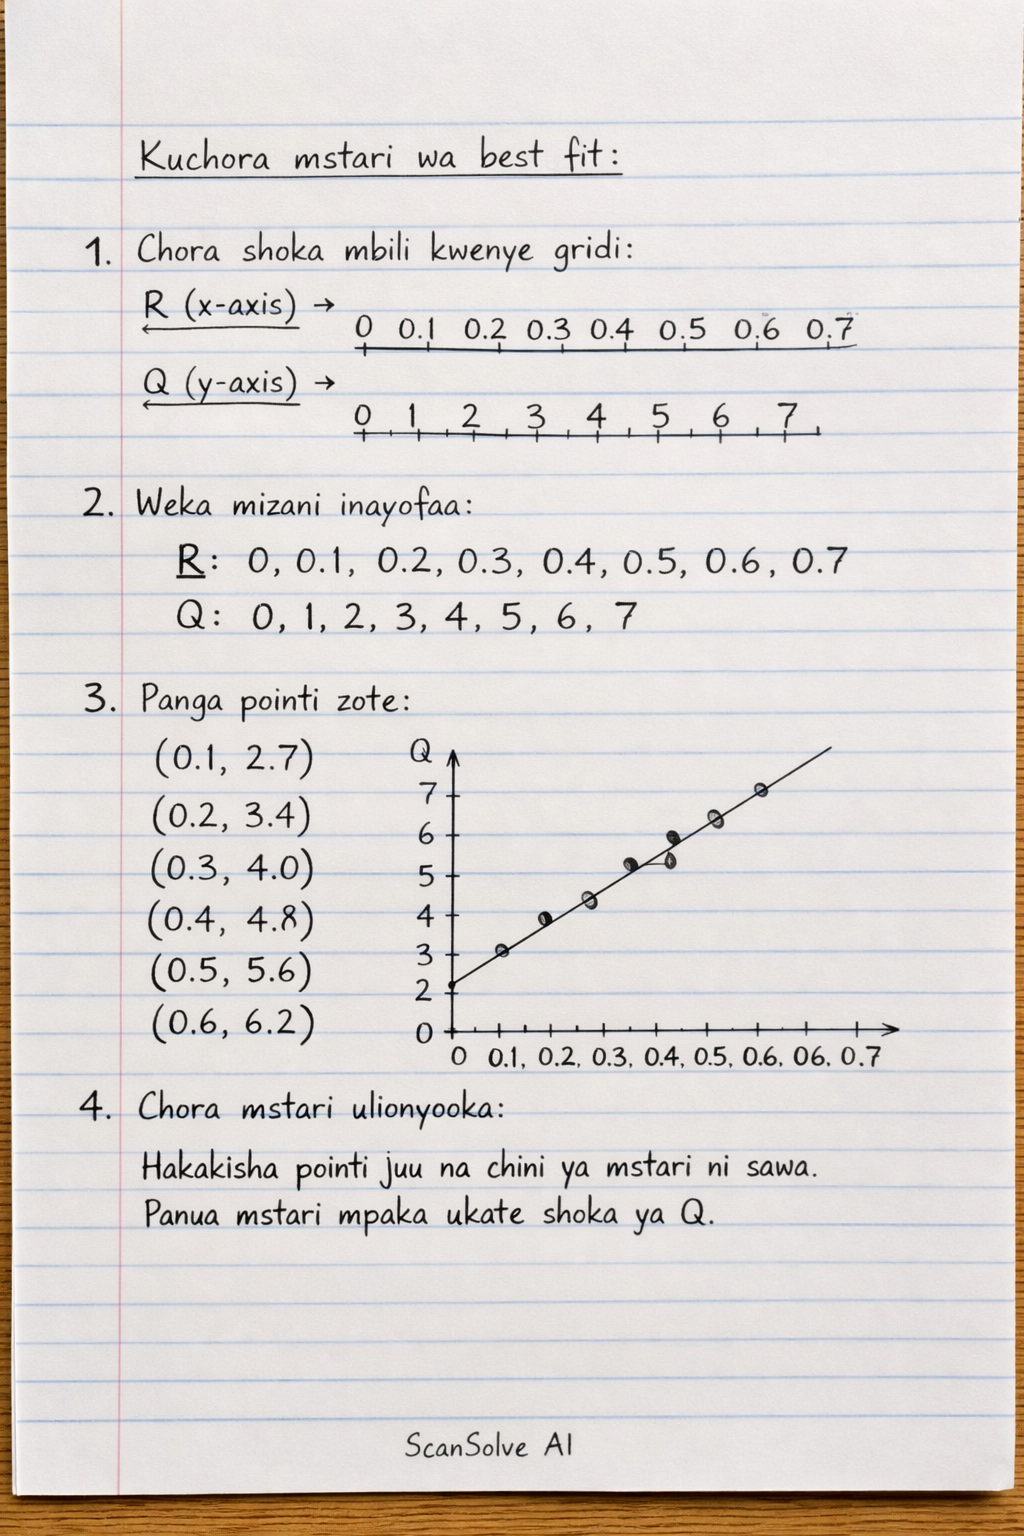
Handwritten Step-by-Step Solution
Get this as a handwritten image on WhatsApp — like a tutor wrote it for you.
Try on WhatsApp