
We read your photo as:
This cumulative frequency diagram shows information about the height, in metres, of each of 100 students. Use it to find the median height.
ScanSolve AI Answer
Answer
Step-by-step solution
9 stepsHere are the solutions for the questions from the image.
Part 1· 4 steps
(Top Graph)
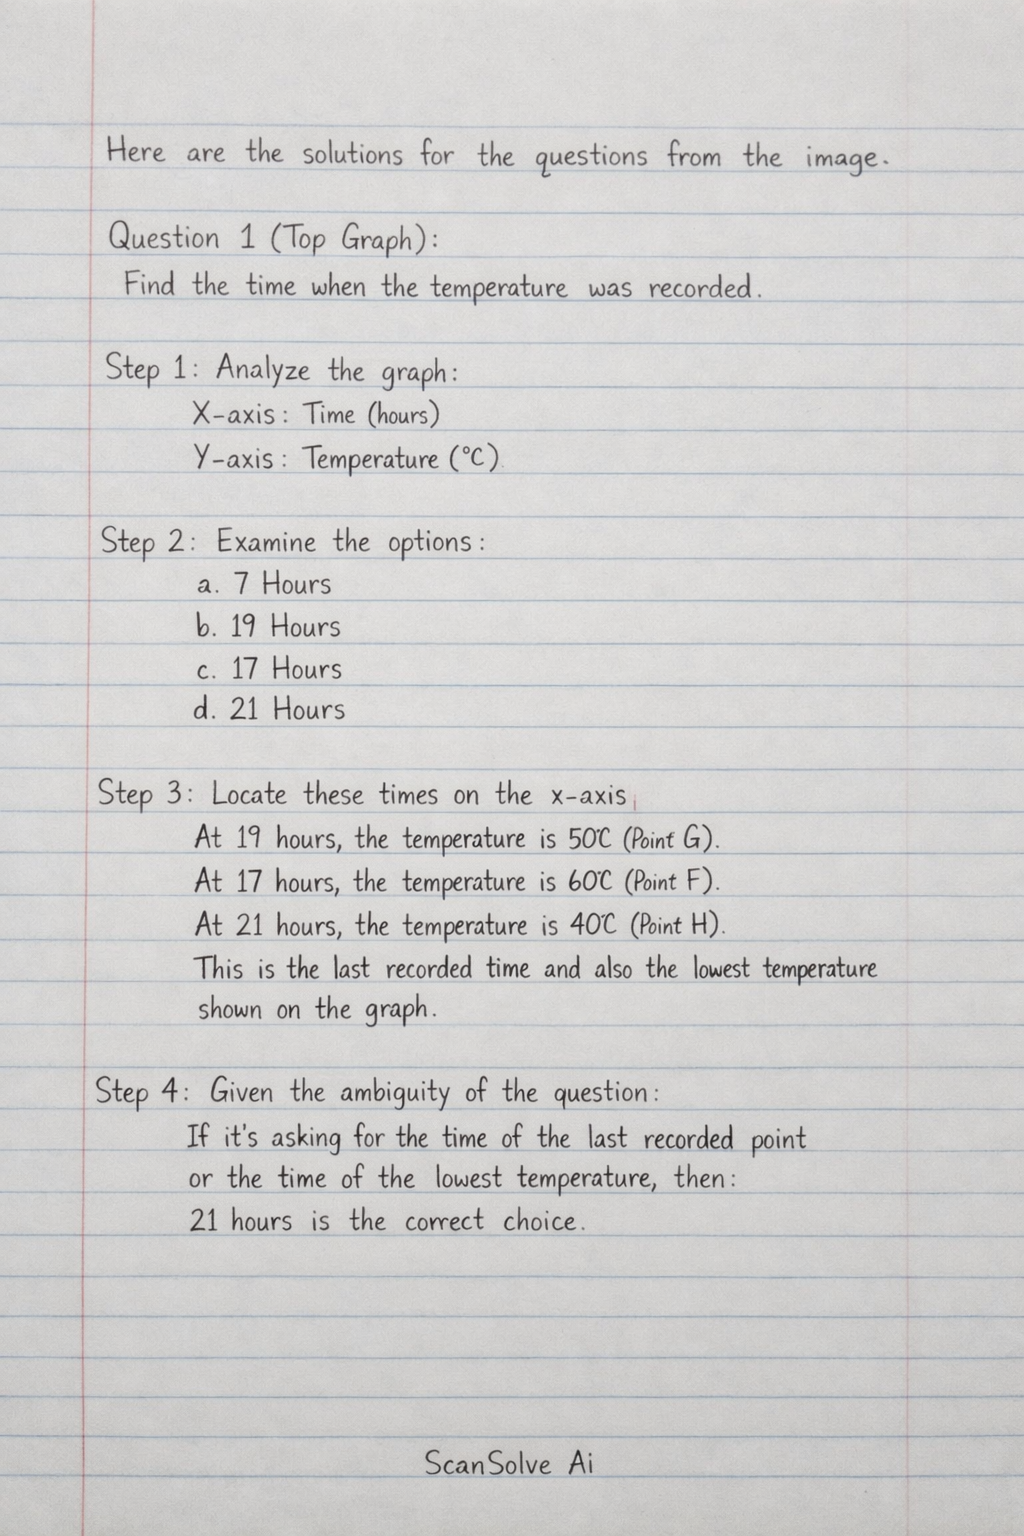
The question asks to find the time when the temperature was recorded. The question text is incomplete, but based on the options and common graph interpretation questions, it likely refers to a specific point or characteristic.
Analyze the graph.
The x-axis represents Time in hours, and the y-axis represents Temperature in degrees Celsius.
Examine the given options
a. 7 Hours, b. 19 Hours, c. 17 Hours, d. 21 Hours.
Locate these times on the x-axis and observe the corresponding temperature or significance.
- At 19 hours, the temperature is 50 degrees Celsius (Point G).
- At 17 hours, the temperature is 60 degrees Celsius (Point F).
- At 21 hours, the temperature is 40 degrees Celsius (Point H). This is the last recorded time and also the lowest temperature shown on the graph.
Given the ambiguity of the question, if it's asking for the time of the last recorded point or the time of the lowest temperature, then 21 hours is the correct choice.
The correct answer is d.
Part d
21 Hours
Part 6· 5 steps
(Bottom Graph)
The question asks to find the median height from the cumulative frequency diagram for 100 students.
Determine the position of the median.
For a cumulative frequency diagram with a total of 100 students, the median corresponds to the cumulative frequency of .
Locate 50 on the cumulative frequency (y-axis).
Draw a horizontal line from to intersect the cumulative frequency curve.
From the intersection point on the curve, draw a vertical line down to the height (x-axis).
Read the value on the x-axis.
- The y-axis has major grid lines every 20 units, with 4 smaller grid lines between them. This means each small grid line represents units. So, 50 is exactly halfway between 40 and 60.
- The x-axis has major grid lines every 0.1 m (e.g., from 1.6 to 1.7), with 4 smaller grid lines between them. This means each small grid line represents m.
- Tracing from to the curve and then down to the x-axis, the line intersects the x-axis at the second small grid line after 1.6 m.
- Therefore, the median height is m.
The correct answer is c.
Part c
Try one yourself
A new problem that tests the same skill.
Still stuck on this one?
Ask a follow-up, and the answer starts from this question.
More Mathematics Questions
Handwritten Step-by-Step Solution
Get this as a handwritten image on WhatsApp — like a tutor wrote it for you.
Try on WhatsApp