
We read your photo as:
Which type of relationship is shown in the graph? Give a reason for the answer
Mathematics
ScanSolve AI Answer
Here are the solutions to Question 2:
2.1.1
The type of relationship shown in the graph is an inverse proportion (or inverse relationship).
Reason: As the number of hours per week increases, the number of weeks required to complete the flying time decreases. This means that the product of the two variables is constant (24 hours).
2.1.2
The total flying time is 24 hours. The relationship is:
Therefore, .
- A: When No. of weeks = 12: So, A =
- C: When No. of hours = 4: So, C =
- B: When No. of weeks = 3: So, B =
- D: When No. of hours = 24: So, D =
2.1.3
- Independent variable: Number of hours per week
- Dependent variable: Number of weeks
Was this helpful?
Still stuck on this one?
Ask a follow-up, and the answer starts from this question.
Got a different question?Ask your own question
More Mathematics Questions
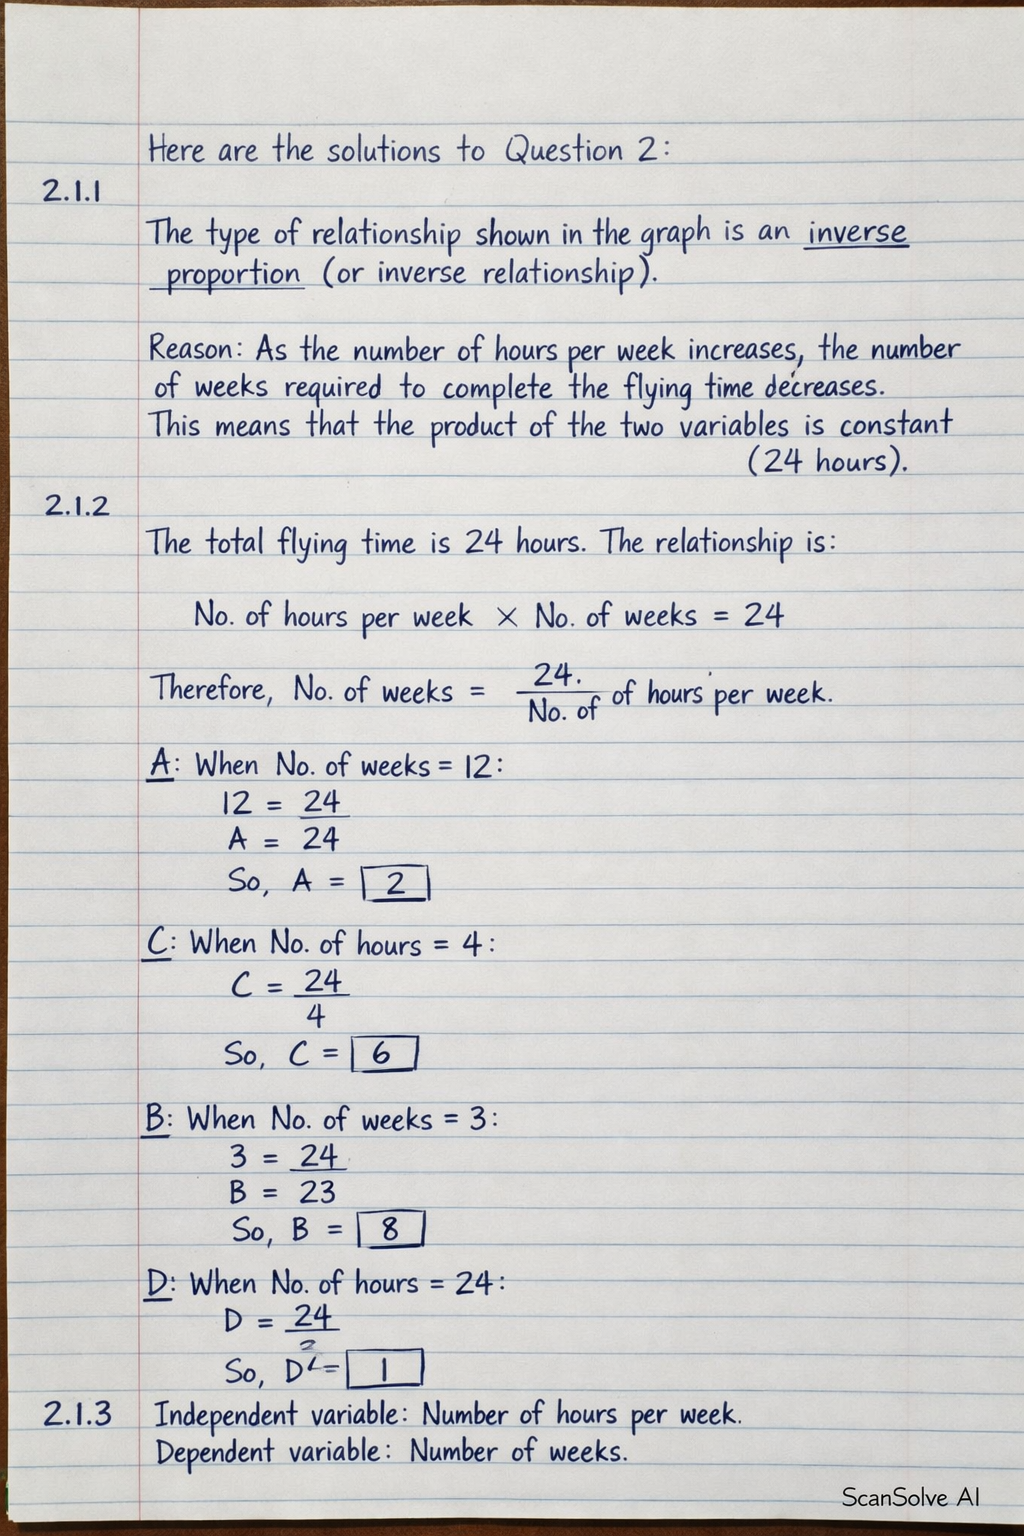
Handwritten Step-by-Step Solution
Get this as a handwritten image on WhatsApp — like a tutor wrote it for you.
Try on WhatsApp