
Answer no 1on a graph
Mathematics
ScanSolve AI Answer
Use the left and right arrow keys to trace the curve, up and down to jump between key points, and plus and minus to zoom.
| Point | x | y |
|---|---|---|
| x-intercept | −2.5 | 0 |
| y-intercept | 0 | 5 |
Step-by-step solution
2 stepsPrepare the table of values for .
To draw the graph, first calculate the values for ranging from to 4.
1 3 0 0 5 1 2 7 2 4 9 3 6 11 4 8 13 Plot the graph using the given scale.
- Draw a horizontal -axis and a vertical -axis on graph paper.
- Mark the origin where the axes intersect.
- Apply the scale: represents on both axes. This means that every grid line (or every large square) should be labeled as for positive values and for negative values on both axes.
- Plot each point from the table above on your graph paper. For example, for , move 3 units left on the -axis and 1 unit down on the -axis.
- Once all points are plotted, use a ruler to draw a straight line that passes through all these points. Extend the line to the edges of your graph paper.
- Label the line with its equation: .
This process will create the graph of the linear equation.
Was this helpful?
Still stuck on this one?
Ask a follow-up, and the answer starts from this question.
Got a different question?Ask your own question
More Mathematics Questions
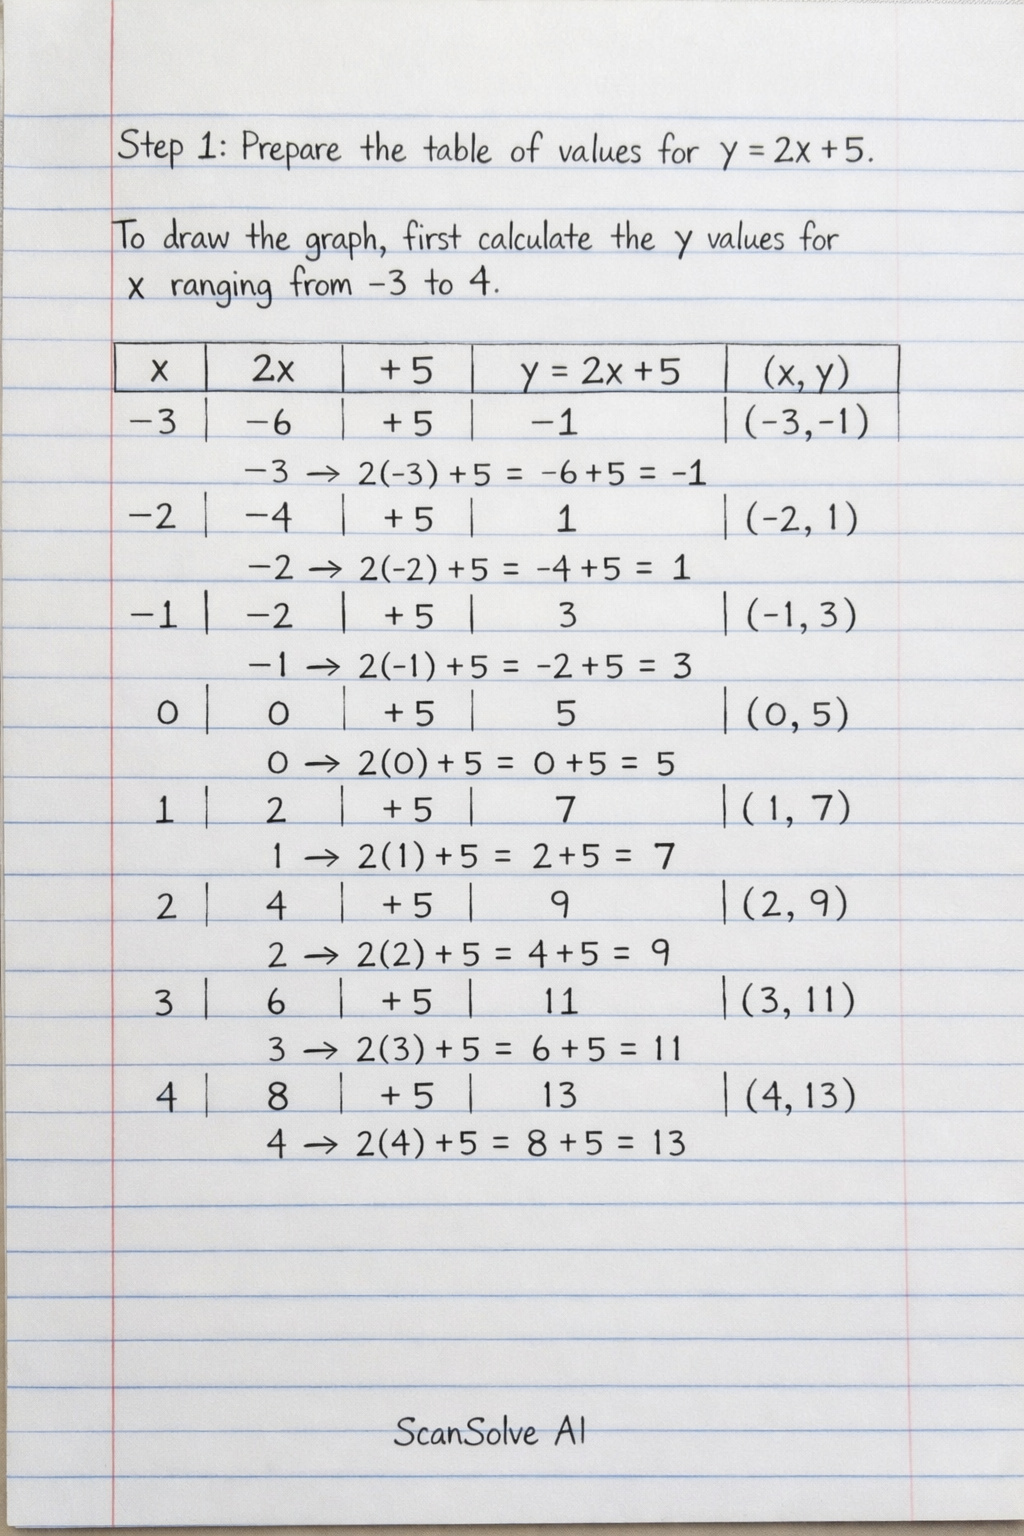
Handwritten Step-by-Step Solution
Get this as a handwritten image on WhatsApp — like a tutor wrote it for you.
Try on WhatsApp