
This physics problem tests your understanding of fundamental physical laws and their applications. The step-by-step solution below breaks down the problem using relevant equations and physical reasoning.
ScanSolve AI Answer
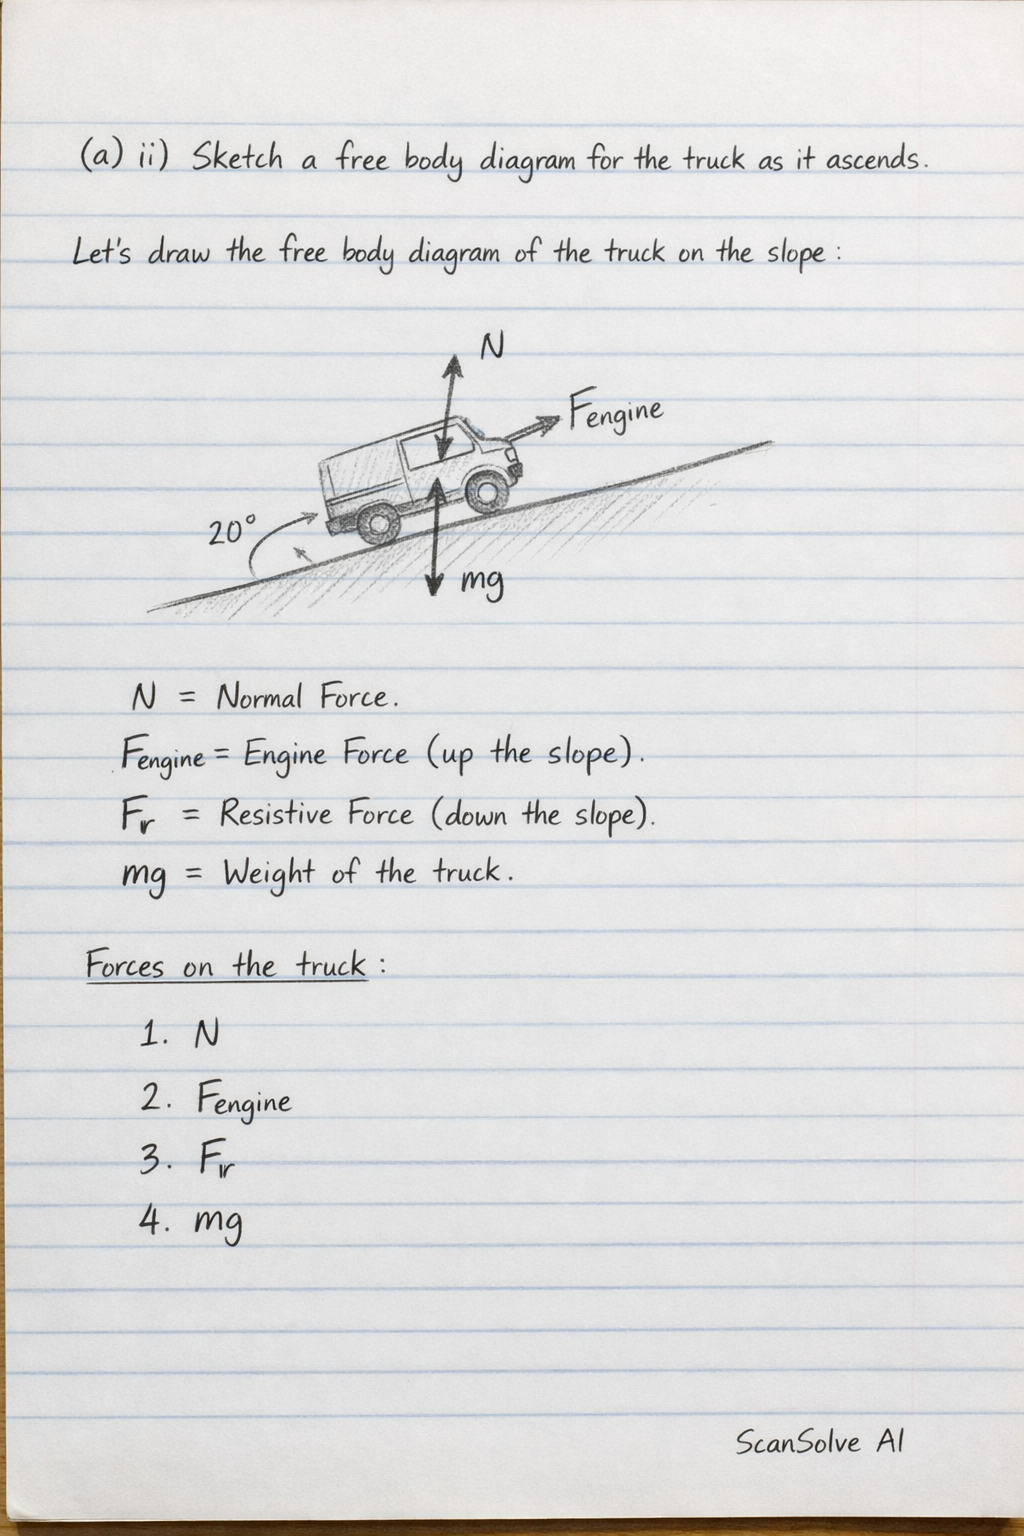
Here are the solutions to the questions from the image: Question 1: a) (i) Sketch a free body diagram for the truck as it ascends. A free body diagram for the truck ascending the slope would show the following forces: Weight (mg): Acting vertically downwards from the center of mass of the truck. Normal Force (N): Acting perpendicular to the slope, upwards from the surface of contact. Engine Force (F_engine): Acting parallel to the slope, pointing upwards along the slope (in the direction of motion). Resistive Force (F_r): Acting parallel to the slope, pointing downwards along the slope (opposing motion). [scale=0.8] % Slope (0,0) -- (6,2.1); [dashed] (0,0) -- (6,0); (0.5,0) arc (0:20:0.5); at (0.8,0.2) 20^; % Truck (simplified as a block) [fill=lightgray] (2,1.05) rectangle (3.5,1.55); [thick] (2,1.05) -- (3.5,1.05); % Bottom of truck [thick] (2,1.55) -- (3.5,1.55); % Top of truck [thick] (2,1.05) -- (2,1.55); % Left of truck [thick] (3.5,1.05) -- (3.5,1.55); % Right of truck % Center of mass (approx) (CM) at (2.75, 1.3); % Forces % Weight [->, thick] (CM) -- +(0,-2) node[below] mg; % Normal Force [->, thick] (2.75,1.3) -- ((2.75,1.3) + (0.6, -1.73)) coordinate (normal_end); (CM) -- (normal_end); [->, thick] (CM) -- ((CM) + (-0.7, 2)) node[above left] N; % Engine Force [->, thick] (CM) -- ((CM) + (2, 0.7)) node[above right] F_engine; % Resistive Force [->, thick] (CM) -- ((CM) + (-1.5, -0.5)) node[below left] F_r; a) (ii) Determine the size of the force from the engine required to just keep it ascending at the constant speed. Step 1: Identify given values and conditions. Mass of truck, m = 2.0 × 10^3 kg Angle of inclination, = 20^ Resistive forces, F_r = 500 N The truck ascends at a constant speed, which means its acceleration a = 0. Acceleration due to gravity, g = 9.8 m/s^2. Step 2: Apply Newton's Second Law along the slope. For constant speed, the net force along the slope is zero. The forces acting along the slope are the engine force upwards, the component of gravity downwards, and the resistive force downwards. F_net = F_engine - mg - F_r = ma Since a=0: F_engine - mg - F_r = 0 F_engine = mg + F_r Step 3: Substitute the values and calculate F_engine. F_engine = (2.0 × 10^3 kg)(9.8 m/s^2) (20^) + 500 N F_engine = (19600 N) × 0.3420 + 500 N F_engine = 6703.2 + 500 N F_engine = 7203.2 N The size of the force from the engine is 7203.2 N. --- Question 6: d) (i) Give one similarity and one difference between a piece of copper wire and a piece of doped silicon in the conduction of an electric current. Similarity: Both copper wire and doped silicon can conduct electric current. Difference: Copper is a metal (conductor) whose electrical resistance increases with increasing temperature. Doped silicon is a semiconductor whose electrical resistance decreases* with increasing temperature. d) (ii) Describe an experiment to determine the value of the resistance of a pure resistor using the ammeter-voltmeter method. Your account should include a diagram, procedure, the observations you will make, how the observation will be used to get a conclusion and precautions. Diagram: A circuit diagram showing a power supply, a switch, a variable resistor (rheostat), the pure resistor (R) under test, an ammeter connected in series with R, and a voltmeter connected in parallel across R. [scale=0.8] % Power Supply (0,0) to (0,1) node[left] +; (0,1) -- (0,1.5); (0,0) -- (0,-0.5); (0,-0.5) to (0,-1) node[left] -; (0,1.5) -- (1.5,1.5); (0,-1) -- (1.5,-1); % Switch (1.5,1.5) -- (2,1.5); (2,1.5) -- (2.5,1.5); (2.25,1.5) circle (0.1); (2.25,1.5) -- (2.25,1.2); % Open switch at (2.25,1.7) S; % Ammeter (2.5,1.5) -- (3.5,1.5); (3,1.5) circle (0.5); at (3,1.5) A; % Resistor (R) (3.5,1.5) -- (4.5,1.5); (4.5,1.5) -- (4.5,0.5); (4.5,0.5) -- (4.5,-0.5); (4.5,-0.5) -- (4.5,-1); (4.5,0) node[right] R; % Label for resistor % Voltmeter (4.5,1.5) -- (5.5,1.5); (5.5,1.5) -- (5.5,-1); (5.5,-1) -- (4.5,-1); (5,0.25) circle (0.5); at (5,0.25) V; % Variable Resistor (Rheostat) (1.5,-1) -- (2.5,-1); (2.5,-1) -- (3.5,-1); (3,-1) node[below] Rheostat; (3,-1) -- (3,0); % Slider (2.5,-1) -- (2.5,-0.5); (3.5,-1) -- (3.5,-0.5); (2.5,-0.5) -- (3.5,-0.5); (3,-0.5) -- (3,0); Procedure: 1. Set up the circuit as shown in the diagram, ensuring all connections are tight. 2. Ensure the power supply is initially off and the variable resistor is set to its maximum resistance. 3. Switch on the power supply. 4. Adjust the variable resistor to vary the current flowing through the circuit. 5. For each adjustment, record the reading of the current (I) from the ammeter and the potential difference (V) across the resistor from the voltmeter. 6. Take at least 5-7 different pairs of (V, I) readings. 7. Switch off the power supply after taking readings. Observations: Record the measured values of V and I in a table. For example: | Reading No. | Voltage V (V) | Current I (A) | |-------------|-----------------|-----------------| | 1 | V_1 | I_1 | | 2 | V_2 | I_2 | | ... | ... | ... | Conclusion: 1. Plot a graph of potential difference V (on the y-axis) against current I (on the x-axis). 2. For a pure (ohmic) resistor, the graph will be a straight line passing through the origin. 3. The resistance R of the resistor is determined by the gradient of this V-I graph. According to Ohm's Law, R = (V)/(I). Precautions: 1. Ensure all connections are clean and tight to minimize contact resistance. 2. Avoid parallax error when reading the ammeter and voltmeter. 3. Do not exceed the maximum current or voltage ratings of the resistor, ammeter, or voltmeter to prevent damage. 4. Switch off the circuit between readings to prevent excessive heating of the resistor, which could change its resistance. e) Figure 5 shows the variation of the electrical resistance of two materials with temperature. e) (i) How will you describe the materials R and S? Material R: Its resistance increases* as temperature increases. This is characteristic of a conductor (e.g., a metal). Material S: Its resistance decreases* as temperature increases. This is characteristic of a semiconductor or an insulator. e) (ii) Sketch another graph on common axes to show how the current through R and S will vary with temperature when the pd across their ends is constant for each. Given that the potential difference (pd) across their ends is constant, the current I is inversely proportional to resistance R (I = V/R). For Material R (conductor): As temperature increases, resistance R increases, so current I will decrease*. For Material S (semiconductor): As temperature increases, resistance R decreases, so current I will increase*. [scale=0.8] % Axes [->] (0,0) -- (6,0) node[right] Temperature (^C); [->] (0,0) -- (0,5) node[above] Current (I); % Curve for R [blue, thick] (0.5,4.5) .. controls (2,3) and (4,1.5) .. (5.5,0.8) node[above right] R; % Curve for S [red, thick] (0.5,0.8) .. controls (2,1.5) and (4,3) .. (5.5,4.5) node[above right] S; f) Figure 6 shows a circuit with items connected in series with an alternating power supply. f) (i) Sketch a graph to show how the current in the circuit will vary when the frequency of the ac supply is made to vary with a constant rms voltage. The circuit in Figure 6 is a series RLC circuit. The current I in such a circuit is given by I = V_rmsZ, where V_rms is the constant RMS voltage and Z is the impedance. The impedance Z is given by Z = sqrt(R^2 + (X_L - X_C)^2), where R is resistance, X_L = 2 f L is inductive reactance, and X_C = (1)/(2 f C) is capacitive reactance. At resonance, X_L = X_C, which means Z = R (minimum impedance), and thus the current I is maximum. The resonant frequency f_0 = (1)/(2(LC)). Given values: R = 100 , L = 0.1 H, C = 400 = 400 × 10^-6 F. Let's calculate the resonant frequency: f_0 = (1)/(2(LC)) f_0 = (1)/(2((0.1 H))(400 × 10^-6) F) f_0 = (1)/(2(4 × 10^-5)) f_0 = (1)/(2 × 0.006324) f_0 ≈ 25.19 Hz The graph of current versus frequency for a series RLC circuit shows a sharp peak at the resonant frequency. [scale=0.8] % Axes [->] (0,0) -- (7,0) node[right] Frequency (f); [->] (0,0) -- (0,5) node[above] Current (I); % Resonant frequency marker [dashed] (3.5,0) -- (3.5,4.5); at (3.5,-0.5) f_0; % Current curve [thick, purple] (0.5,0.5) .. controls (2,3) and (3,4.5) .. (3.5,4.5) .. controls (4,4.5) and (5,3) .. (6.5,0.5); Drop the next question.