
This physics problem tests your understanding of fundamental physical laws and their applications. The step-by-step solution below breaks down the problem using relevant equations and physical reasoning.
ScanSolve AI Answer
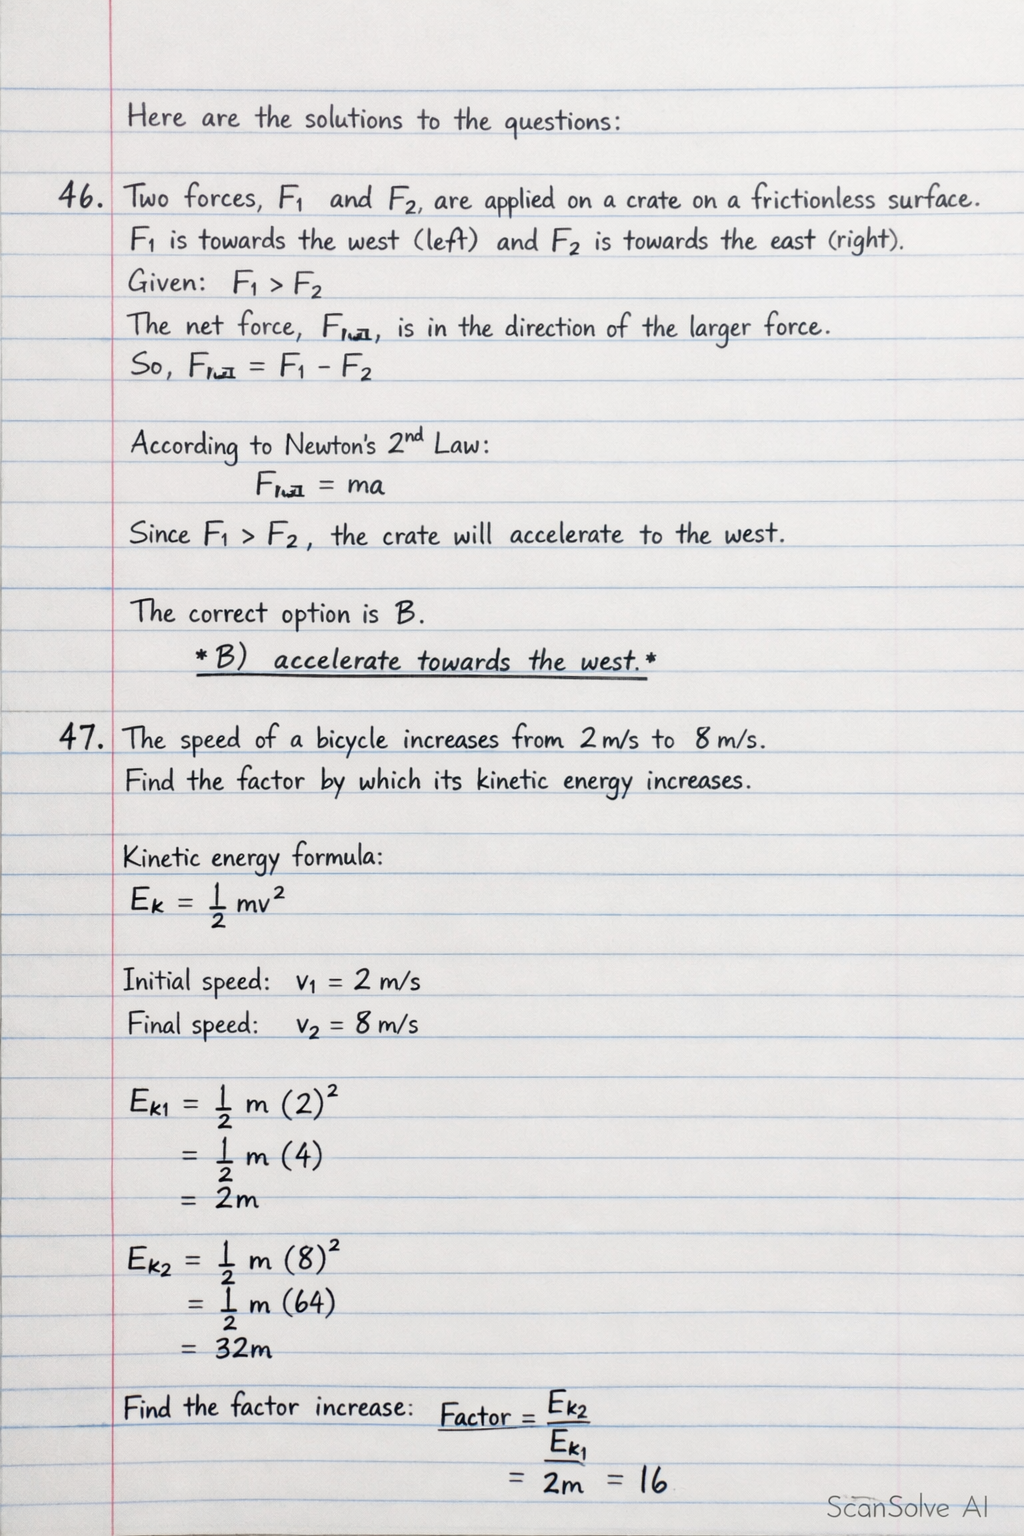
Here are the solutions to the questions: 46. Two forces, F_1 and F_2, are applied on a crate lying on a frictionless, horizontal surface. F_1 is directed towards the west (left) and F_2 is directed towards the east (right). The problem states that the magnitude of force F_1 is greater than that of force F_2. Since the surface is frictionless, the net force on the crate determines its motion. The net force F_net will be in the direction of the larger force. Given F_1 > F_2, the net force will be in the direction of F_1, which is towards the west. According to Newton's Second Law, a net force causes acceleration. Therefore, the crate will accelerate towards the west. The correct option is B. B) accelerate towards the west. 47. The speed of a bicycle increases from 2 m·s^-1 to 8 m·s^-1. We need to find the factor by which its kinetic energy increases. The formula for kinetic energy is E_k = (1)/(2)mv^2. Step 1: Calculate the initial kinetic energy (E_k1). E_k1 = (1)/(2)m(v_1)^2 E_k1 = (1)/(2)m(2 m·s^-1)^2 E_k1 = (1)/(2)m(4 m^2·s^-2) E_k1 = 2m Step 2: Calculate the final kinetic energy (E_k2). E_k2 = (1)/(2)m(v_2)^2 E_k2 = (1)/(2)m(8 m·s^-1)^2 E_k2 = (1)/(2)m(64 m^2·s^-2) E_k2 = 32m Step 3: Determine the factor of increase. The factor of increase is the ratio of the final kinetic energy to the initial kinetic energy. Factor = E_k2E_k1 Factor = (32m)/(2m) Factor = 16 The correct option is D. D) 16 48. The pressure versus time graphs represent sound waves. We need to identify the graph that best represents a sound wave with the highest frequency and the loudest sound. • Frequency is the number of cycles per unit time. A higher frequency means more oscillations (waves) occur within the same time interval. • Loudness is related to the amplitude of the sound wave. A louder sound corresponds to a larger amplitude, which means a greater variation in pressure from the equilibrium. Let's analyze the graphs: • Graph A shows many oscillations within the given time, indicating high frequency. It also shows the largest vertical displacement (amplitude), indicating a loud sound. • Graph B shows fewer oscillations than A (lower frequency) and a smaller amplitude than A (quieter sound). • Graph C shows the fewest oscillations (lowest frequency) and a smaller amplitude than A (quieter sound). • Graph D shows fewer oscillations than A (lower frequency) and a smaller amplitude than A (quieter sound). Comparing all options, Graph A has both the highest frequency (most waves in the given time) and the largest amplitude (loudest sound). The correct option is A. A) 3 done, 2 left today. You're making progress.