
We read your photo as:
Read and record the voltage and the corresponding current readings. Tabulate the results. Plot a graph with voltage (V) on the vertical axis and current (I) on the horizontal axis. Determine the slope of the graph. State the significance of the slope.
Physics
ScanSolve AI Answer
a)
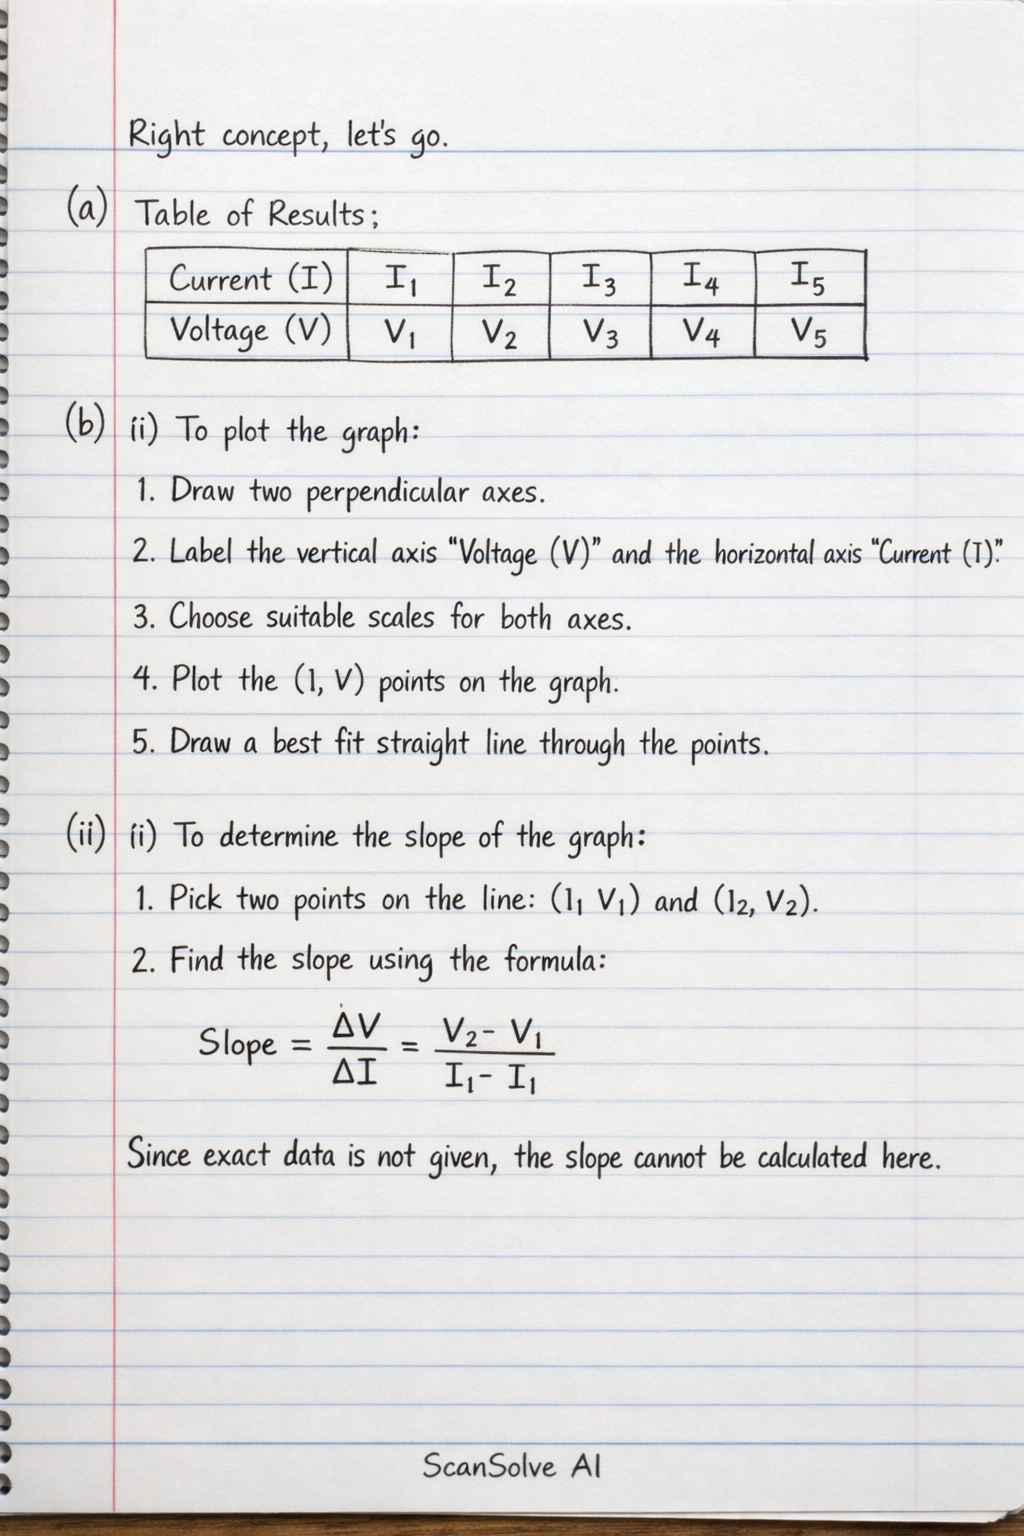
To complete this part, you would need to perform the experiment and record the actual voltage and current readings. Below is a template for tabulating the results:
| Current (I) | |||||
|---|---|---|---|---|---|
| Voltage (V) |
b)
(i) To plot the graph:
- Draw two perpendicular axes.
- Label the vertical axis "Voltage (V)" and the horizontal axis "Current (I)".
- Choose appropriate scales for both axes to accommodate your recorded data.
- Plot each pair of (Current, Voltage) readings as a point on the graph.
- Draw a straight line of best fit through the plotted points.
(ii) To determine the slope of the graph:
- Choose two distinct points on the straight line of best fit, say and .
- Calculate the slope using the formula: Since the actual readings are not provided, a numerical value for the slope cannot be determined here.
(iii) The significance of the slope:
The slope of the Voltage (V) versus Current (I) graph represents the resistance of the conductor. According to Ohm's Law, , so . Therefore, the slope of this graph gives the value of the resistance in ohms ().
Was this helpful?
Still stuck on this one?
Ask a follow-up, and the answer starts from this question.
Got a different question?Ask your own question
More Physics Questions
QPlot a graph with voltage (V) on the vertical axis and current (I) on the horizontal axis. (ii)…QDraw a graph of Voltage vs. Current for the given series data and calculate its slope.QUsing the provided graph, estimate V when I = 10.0 A, estimate I when V = 8.0 V, and determine the…QPlot a graph of potential difference, V, on the y-axis against current, I, on the x-axis. Determine…QState Ohm's law. (ii) Describe how to plot a V-I graph given the data table. (iii) Calculate the…
Handwritten Step-by-Step Solution
Get this as a handwritten image on WhatsApp — like a tutor wrote it for you.
Try on WhatsApp