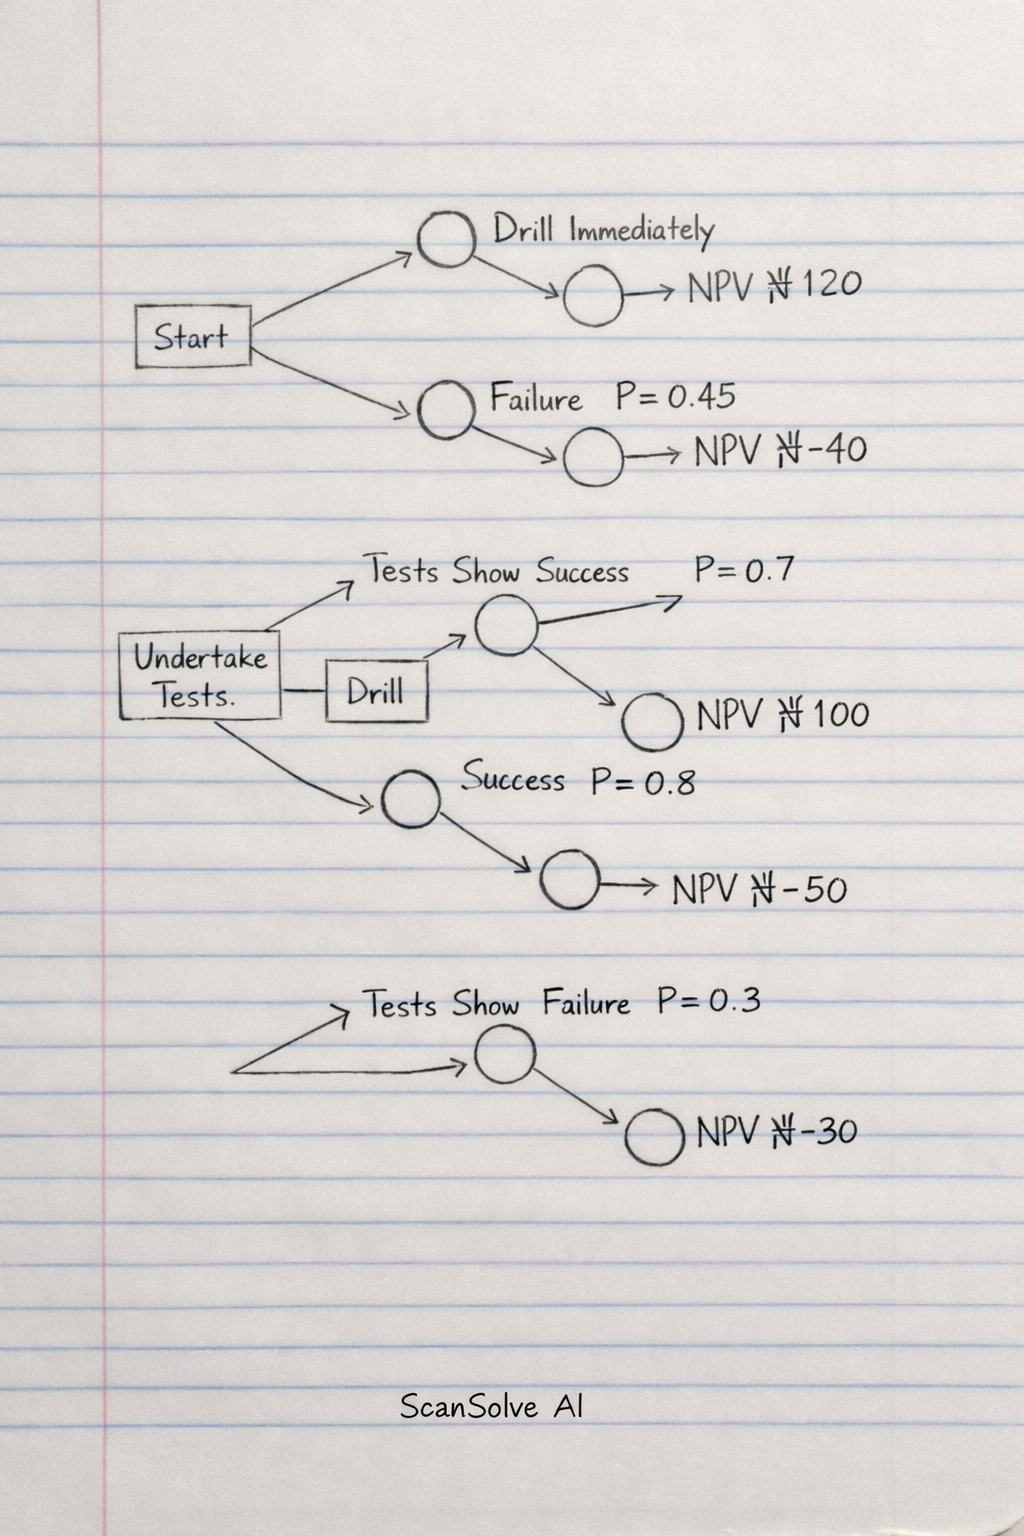
We read your photo as:

Draw up a decision (probability) tree diagram to represent the above information.

Business/Management

ScanSolve AI Answer

Step-by-step solution

5 steps

Part a

Draw up a decision (probability) tree diagram to represent the above information.

A decision tree visually represents the decision points (squares), chance events (circles), probabilities, and outcomes.

Decision Tree Diagram:

Start (Decision Node)1. Drill Immediately (No Tests)Chance Node (Drilling Outcome)Success (P=0.55)→NPV N120Failure (P=0.45)→NPV N−402. Undertake TestsChance Node (Test Results)Tests Show Success (P=0.7)Decision Nodea) DrillChance Node (Drilling Outcome)Success (P=0.8)→NPV N100Failure (P=0.2)→NPV N−50b) Sell Exploitation Rights→NPV N65Tests Show Failure (P=0.3)Decision Nodea) DrillChance Node (Drilling Outcome)Success (P=0.2)→NPV N100Failure (P=0.8)→NPV N−50b) Sell Exploitation Rights→NPV N153. Sell Exploitation Rights Immediately (No Tests)→NPV N45\begin{array}{ll} \textbf{Start (Decision Node)} & \\ \quad \text{1. Drill Immediately (No Tests)} & \\ \qquad \text{Chance Node (Drilling Outcome)} & \\ \qquad \quad \text{Success (P=0.55)} & \rightarrow \text{NPV } \text{N}120 \\ \qquad \quad \text{Failure (P=0.45)} & \rightarrow \text{NPV } \text{N}-40 \\ \quad \text{2. Undertake Tests} & \\ \qquad \text{Chance Node (Test Results)} & \\ \qquad \quad \text{Tests Show Success (P=0.7)} & \\ \qquad \qquad \text{Decision Node} & \\ \qquad \qquad \quad \text{a) Drill} & \\ \qquad \qquad \qquad \text{Chance Node (Drilling Outcome)} & \\ \qquad \qquad \qquad \quad \text{Success (P=0.8)} & \rightarrow \text{NPV } \text{N}100 \\ \qquad \qquad \qquad \quad \text{Failure (P=0.2)} & \rightarrow \text{NPV } \text{N}-50 \\ \qquad \qquad \quad \text{b) Sell Exploitation Rights} & \rightarrow \text{NPV } \text{N}65 \\ \qquad \quad \text{Tests Show Failure (P=0.3)} & \\ \qquad \qquad \text{Decision Node} & \\ \qquad \qquad \quad \text{a) Drill} & \\ \qquad \qquad \qquad \text{Chance Node (Drilling Outcome)} & \\ \qquad \qquad \qquad \quad \text{Success (P=0.2)} & \rightarrow \text{NPV } \text{N}100 \\ \qquad \qquad \qquad \quad \text{Failure (P=0.8)} & \rightarrow \text{NPV } \text{N}-50 \\ \qquad \qquad \quad \text{b) Sell Exploitation Rights} & \rightarrow \text{NPV } \text{N}15 \\ \quad \text{3. Sell Exploitation Rights Immediately (No Tests)} & \rightarrow \text{NPV } \text{N}45 \\ \end{array}

Part b· 5 steps

Evaluate the tree in order to advise the management of the company on its best course of action.

We evaluate the tree by calculating the Expected Monetary Value (EMV) for each chance node and selecting the option with the highest EMV at each decision node, working backward from the end of the tree.

  1. Calculate EMV for drilling after successful tests.

    EMVDrill | Test Success=(0.8×N100)+(0.2×N−50)=N80−N10=N70\text{EMV}_{\text{Drill | Test Success}} = (0.8 \times \text{N}100) + (0.2 \times \text{N}-50) = \text{N}80 - \text{N}10 = \text{N}70

    Comparing this to selling rights (N65), the best option if tests show success is to drill.

  2. Calculate EMV for drilling after failed tests.

    EMVDrill | Test Failure=(0.2×N100)+(0.8×N−50)=N20−N40=N−20\text{EMV}_{\text{Drill | Test Failure}} = (0.2 \times \text{N}100) + (0.8 \times \text{N}-50) = \text{N}20 - \text{N}40 = \text{N}-20

    Comparing this to selling rights (N15), the best option if tests show failure is to sell exploitation rights.

  3. Calculate EMV for undertaking tests.

    EMVUndertake Tests=(0.7×EMVDrill | Test Success)+(0.3×EMVSell | Test Failure)\text{EMV}_{\text{Undertake Tests}} = (0.7 \times \text{EMV}_{\text{Drill | Test Success}}) + (0.3 \times \text{EMV}_{\text{Sell | Test Failure}}) EMVUndertake Tests=(0.7×N70)+(0.3×N15)=N49+N4.5=N53.5\text{EMV}_{\text{Undertake Tests}} = (0.7 \times \text{N}70) + (0.3 \times \text{N}15) = \text{N}49 + \text{N}4.5 = \text{N}53.5
  4. Calculate EMV for drilling immediately (no tests).

    EMVDrill Immediately=(0.55×N120)+(0.45×N−40)=N66−N18=N48\text{EMV}_{\text{Drill Immediately}} = (0.55 \times \text{N}120) + (0.45 \times \text{N}-40) = \text{N}66 - \text{N}18 = \text{N}48
  5. Compare the EMVs of the main decision options.

    • Drill Immediately: N48
    • Undertake Tests: N53.5
    • Sell Exploitation Rights Immediately: N45

    The highest EMV is N53.5, which corresponds to undertaking tests.

    Advice to Management:
    The company should undertake tests.

    • If the tests show success, the company should then drill.
    • If the tests show failure, the company should then sell the exploitation rights.

Part c

Discuss the value of decision tree in providing management with guidance for decision making.

Decision trees are valuable tools for management because they provide a structured and visual framework for analyzing complex decisions, especially those involving uncertainty and sequential choices. They help in identifying all possible courses of action, their associated probabilities, and the financial outcomes of each path. By calculating Expected Monetary Values (EMVs), decision trees enable managers to quantitatively compare alternatives and choose the option that maximizes expected value. This systematic approach enhances clarity, facilitates communication among stakeholders, and supports more informed and rational decision-making by explicitly considering risks and potential rewards.

Was this helpful?

Still stuck on this one?

Ask a follow-up, and the answer starts from this question.

Got a different question?Ask your own question
Handwritten step-by-step solution preview

Handwritten Step-by-Step Solution

Get this as a handwritten image on WhatsApp — like a tutor wrote it for you.

Try on WhatsApp