
This business/management problem is solved step by step below, with detailed explanations to help you understand the method and arrive at the correct answer.
ScanSolve AI Answer
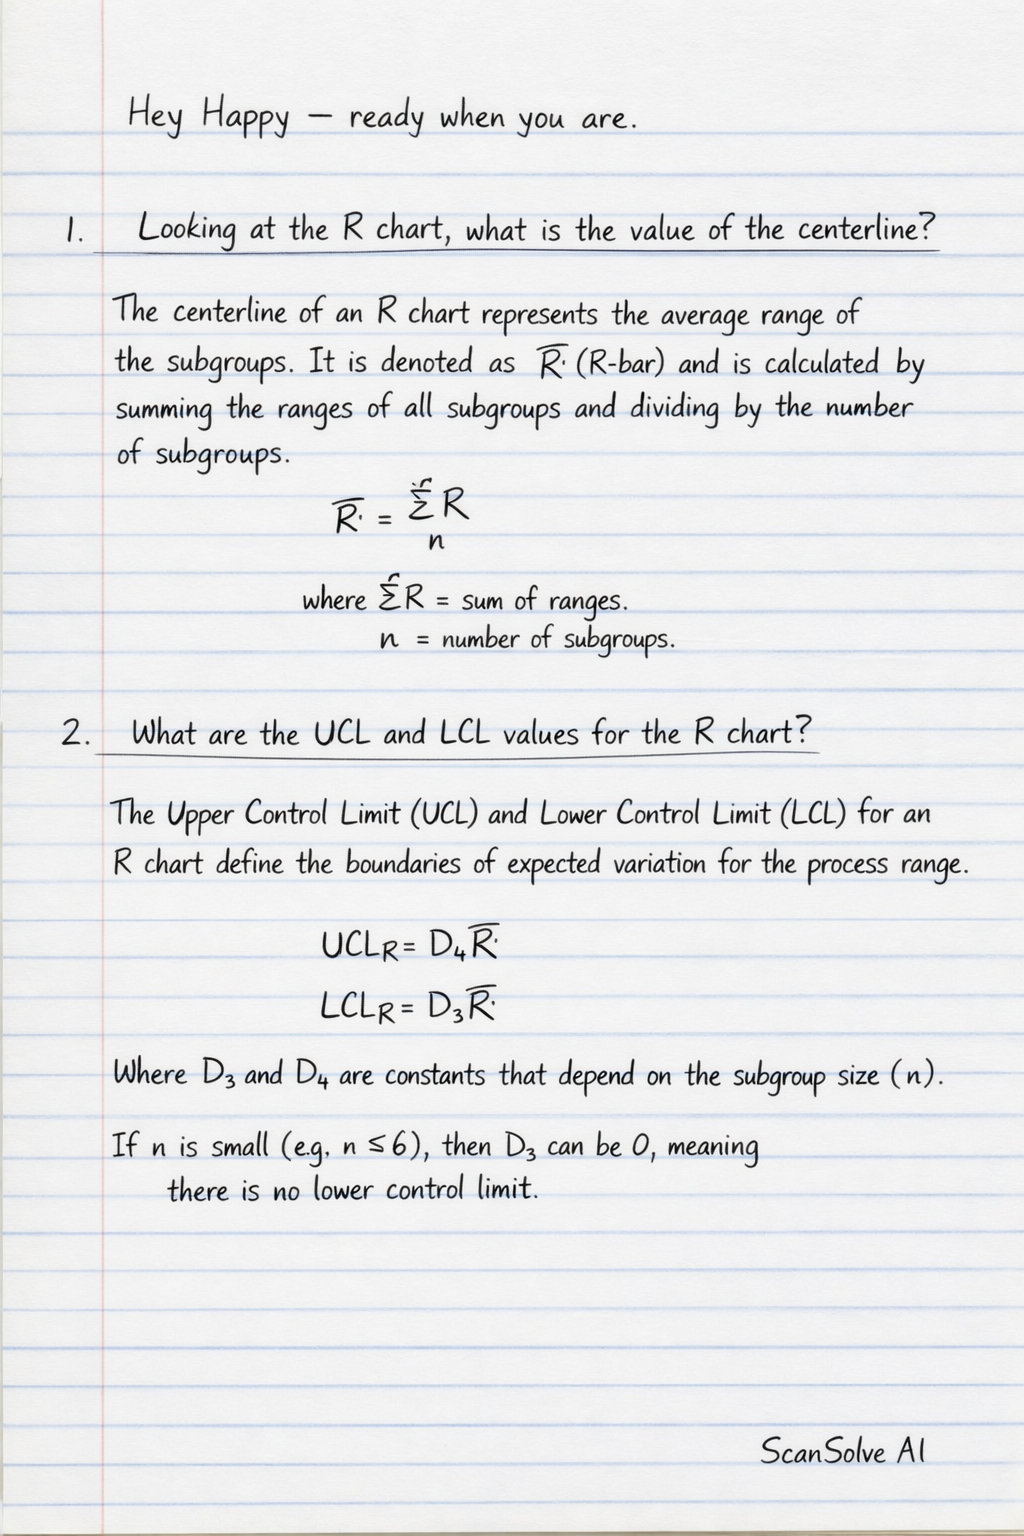
Hey Happy — ready when you are. Since the R chart and x-bar chart are not provided, the answers below describe what these values and charts represent in general. 1. Looking at the R chart, what is the value of the centerline? The centerline of an R chart represents the average range of the subgroups. It is denoted as R (R-bar) and is calculated by summing the ranges of all subgroups and dividing by the number of subgroups. 2. What are the UCL and LCL values for the R chart? The Upper Control Limit (UCL) and Lower Control Limit (LCL) for an R chart define the boundaries of expected variation for the process range. UCL_R = D_4 R LCL_R = D_3 R Where D_3 and D_4 are constants that depend on the subgroup size (n). If n is small (e.g., n 6), D_3 can be 0, meaning there is no lower control limit. 3. What does the R chart tell you about the process? The R chart monitors the variability or spread of a process over time. It indicates whether the process variation is in statistical control. If all points fall within the control limits and show no specific patterns, the process variability is considered stable. Points outside the limits or non-random patterns suggest that the process variability is out of control. 4. Answer the same questions for the x bar chart. a) Centerline for the x-bar chart: The centerline of an x-bar chart represents the overall average of the subgroup means. It is denoted as X (X-double bar) and indicates the central tendency of the process. b) UCL and LCL values for the x-bar chart: The Upper Control Limit (UCL) and Lower Control Limit (LCL) for an x-bar chart define the boundaries of expected variation for the process mean. UCL_X = X + A_2 R LCL_X = X - A_2 R Where A_2 is a constant that depends on the subgroup size (n), and R is the average range from the R chart. c) What the x-bar chart tells you about the process: The x-bar chart monitors the central tendency or average of a process over time. It indicates whether the process mean is in statistical control. If all points fall within the control limits and show no specific patterns, the process mean is considered stable. Points outside the limits or non-random patterns suggest that the process mean is out of control. Send me the next one 📸