
We read your photo as:
Explain homogeneous mixtures and the deviation from Raoult's law for ethanol and carbon disulfide mixtures, including a phase diagram.
ScanSolve AI Answer
Here are the answers to your questions:
d)
i) A homogeneous mixture is a mixture in which the components are uniformly distributed throughout the mixture, resulting in a single phase. The composition and properties are the same throughout the mixture, and the individual components cannot be visually distinguished. An example is salt dissolved in water.
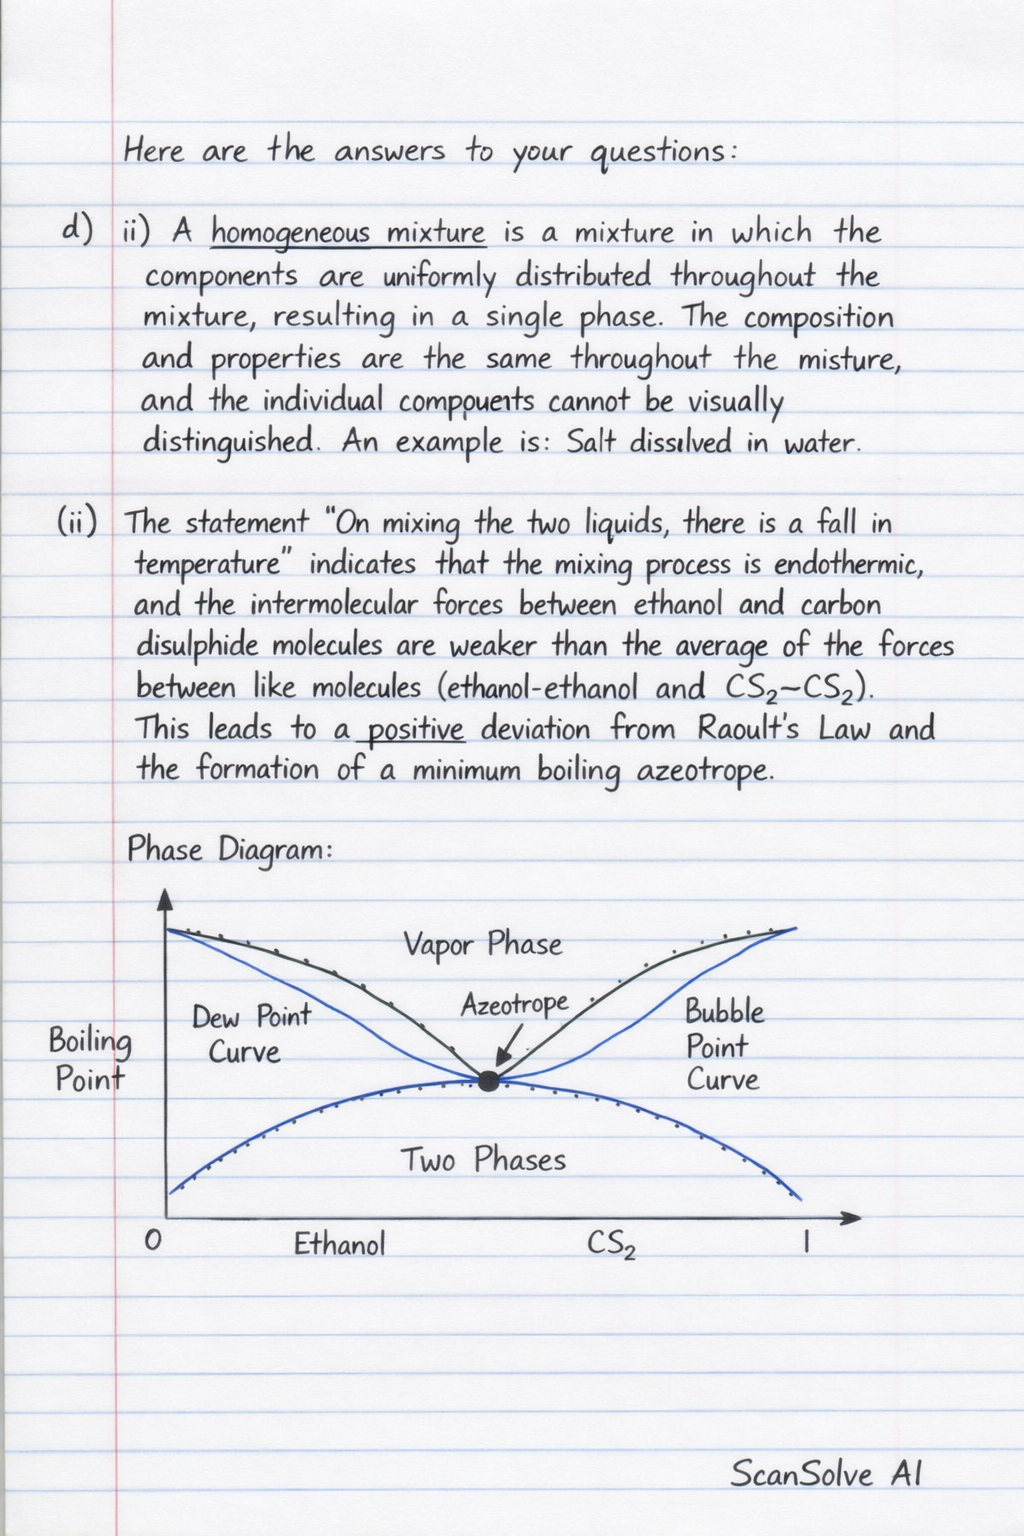
ii) The statement "On mixing the two liquids, there is a fall in temperature" indicates that the mixing process is endothermic, and the intermolecular forces between ethanol and carbon disulphide molecules are weaker than the average of the forces between like molecules (ethanol-ethanol and -). This leads to a positive deviation from Raoult's Law and the formation of a minimum boiling azeotrope.
Here is the labelled phase diagram:
\begin{tikzpicture}[scale=1.2]
    % Axes
    \draw[->] (0,0) -- (6.5,0) node[below] {Composition (Mole fraction of Ethanol)};
    \draw[->] (0,0) -- (0,5) node[left] {Boiling Point};

    % Boiling points of pure components
    \node at (-0.5, 1.5) {$T_{\text{CS}_2}$}; % BP of CS2 (approx 46°C)
    \node at (-0.5, 4) {$T_{\text{Ethanol}}$}; % BP of Ethanol (approx 78°C)

    \draw[dashed] (0,1.5) -- (0.2,1.5);
    \draw[dashed] (0,4) -- (0.2,4);

    % Liquid curve
    \draw[thick, blue] (0,1.5) .. controls (1.5,0.5) and (3.5,0.5) .. (4.5,0.8) .. controls (5.5,1.5) and (6,4) .. (6,4);
    \node[blue, above right] at (3.5, 0.8) {Liquid Curve};

    % Vapor curve
    \draw[thick, red] (0,1.5) .. controls (1.5,1.2) and (3.5,1.2) .. (4.5,0.8) .. controls (5.5,1.5) and (6,4) .. (6,4);
    \node[red, below right] at (3.5, 1.2) {Vapor Curve};

    % Azeotropic point
    \fill (4.5,0.8) circle (2pt) node[below right] {Azeotropic Point};
    \node at (-0.5, 0.8) {$T_{\text{Azeotrope}}$};
    \draw[dashed] (0,0.8) -- (4.5,0.8);
    \draw[dashed] (4.5,0) -- (4.5,0.8);
    \node at (4.5, -0.3) {$X_{\text{Azeotrope}}$};

    % Regions
    \node at (3, 3) {Vapor};
    \node at (3, 0.4) {Liquid};
    \node at (2, 2) {Liquid + Vapor};
\end{tikzpicture}Still stuck on this one?
Ask a follow-up, and the answer starts from this question.
More Chemistry Questions
Handwritten Step-by-Step Solution
Get this as a handwritten image on WhatsApp — like a tutor wrote it for you.
Try on WhatsApp