
This chemistry question involves key chemical concepts and calculations. The detailed solution below walks through each step, from identifying the reaction type to computing the final answer.
ScanSolve AI Answer
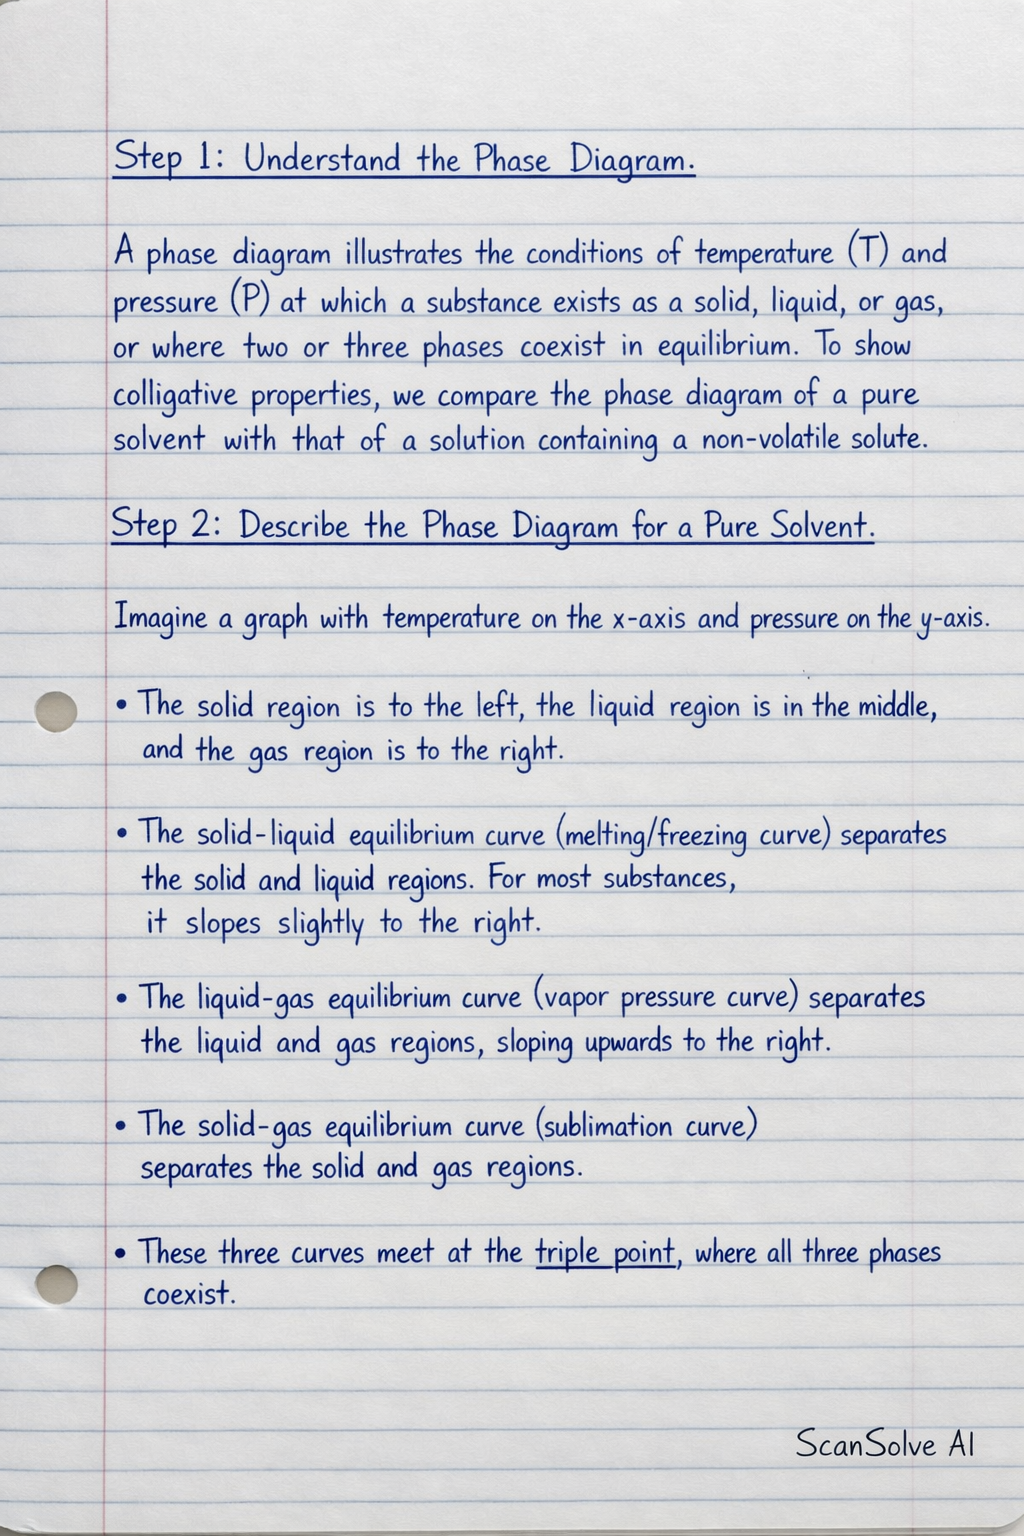
Step 1: Understand the Phase Diagram. A phase diagram illustrates the conditions of temperature (T) and pressure (P) at which a substance exists as a solid, liquid, or gas, or where two or three phases coexist in equilibrium. To show colligative properties, we compare the phase diagram of a pure solvent with that of a solution containing a non-volatile solute. Step 2: Describe the Phase Diagram for a Pure Solvent. Imagine a graph with temperature on the x-axis and pressure on the y-axis. • The solid region is to the left, the liquid region is in the middle, and the gas region is to the right. • The solid-liquid equilibrium curve (melting/freezing curve) separates the solid and liquid regions. For most substances, it slopes slightly to the right. • The liquid-gas equilibrium curve (vapor pressure curve) separates the liquid and gas regions, sloping upwards to the right. • The solid-gas equilibrium curve (sublimation curve) separates the solid and gas regions. • These three curves meet at the triple point, where all three phases coexist. • The normal boiling point is the temperature where the liquid-gas curve intersects 1 atm pressure. • The normal freezing point is the temperature where the solid-liquid curve intersects 1 atm pressure. Step 3: Illustrate Colligative Properties with the Solution's Phase Diagram. When a non-volatile solute is added to a solvent, the vapor pressure of the solvent is lowered. This causes a shift in all the equilibrium curves for the solution relative to the pure solvent: • Vapor Pressure Lowering: The liquid-gas equilibrium curve for the solution lies below the curve for the pure solvent. This means at any given temperature, the solution has a lower vapor pressure than the pure solvent. • Boiling Point Elevation: Because the solution's vapor pressure curve is lower, a higher temperature is required for the solution's vapor pressure to reach the external atmospheric pressure (e.g., 1 atm). This shifts the normal boiling point to a higher temperature (T_b > T_b^0). • Freezing Point Depression: The solid-liquid equilibrium curve for the solution is also shifted downwards and to the left. This means the freezing point of the solution is lower than that of the pure solvent (T_f < T_f^0). The triple point for the solution also shifts to a lower temperature and pressure. In summary, a single phase diagram illustrating these properties would show two sets of curves: one for the pure solvent and one for the solution. The solution's curves would be shifted downwards and to the right for the liquid-gas boundary (showing vapor pressure lowering and boiling point elevation) and downwards and to the left for the solid-liquid boundary (showing freezing point depression), relative to the pure solvent's curves. That's 2 down. 3 left today — send the next one.