
We read your photo as:
State the effect on the demand curve caused by the following situation and illustrate with the aid of a diagram in the space provided below. Label and indicate with arrows correctly. a) The demand for tea increases as a result of an increase in the price of coffee.
Economics
ScanSolve AI Answer
a) When the price of coffee increases, consumers will substitute coffee with tea, as they are substitute goods. This leads to an increase in the demand for tea, causing the entire demand curve for tea to shift to the right.
\begin{tikzpicture}
    % Axes
    \draw[->] (0,0) -- (0,5) node[left] {Price of Tea};
    \draw[->] (0,0) -- (6,0) node[below] {Quantity of Tea};

    % Initial Demand Curve (D1)
    \draw[blue, thick] (1,4) node[above left] {$D_1$} -- (5,1);

    % New Demand Curve (D2)
    \draw[red, thick] (2,4) node[above right] {$D_2$} -- (6,1);

    % Arrow indicating shift
    \draw[->, dashed, thick] (3,2.5) -- (4,2.5);
\end{tikzpicture}
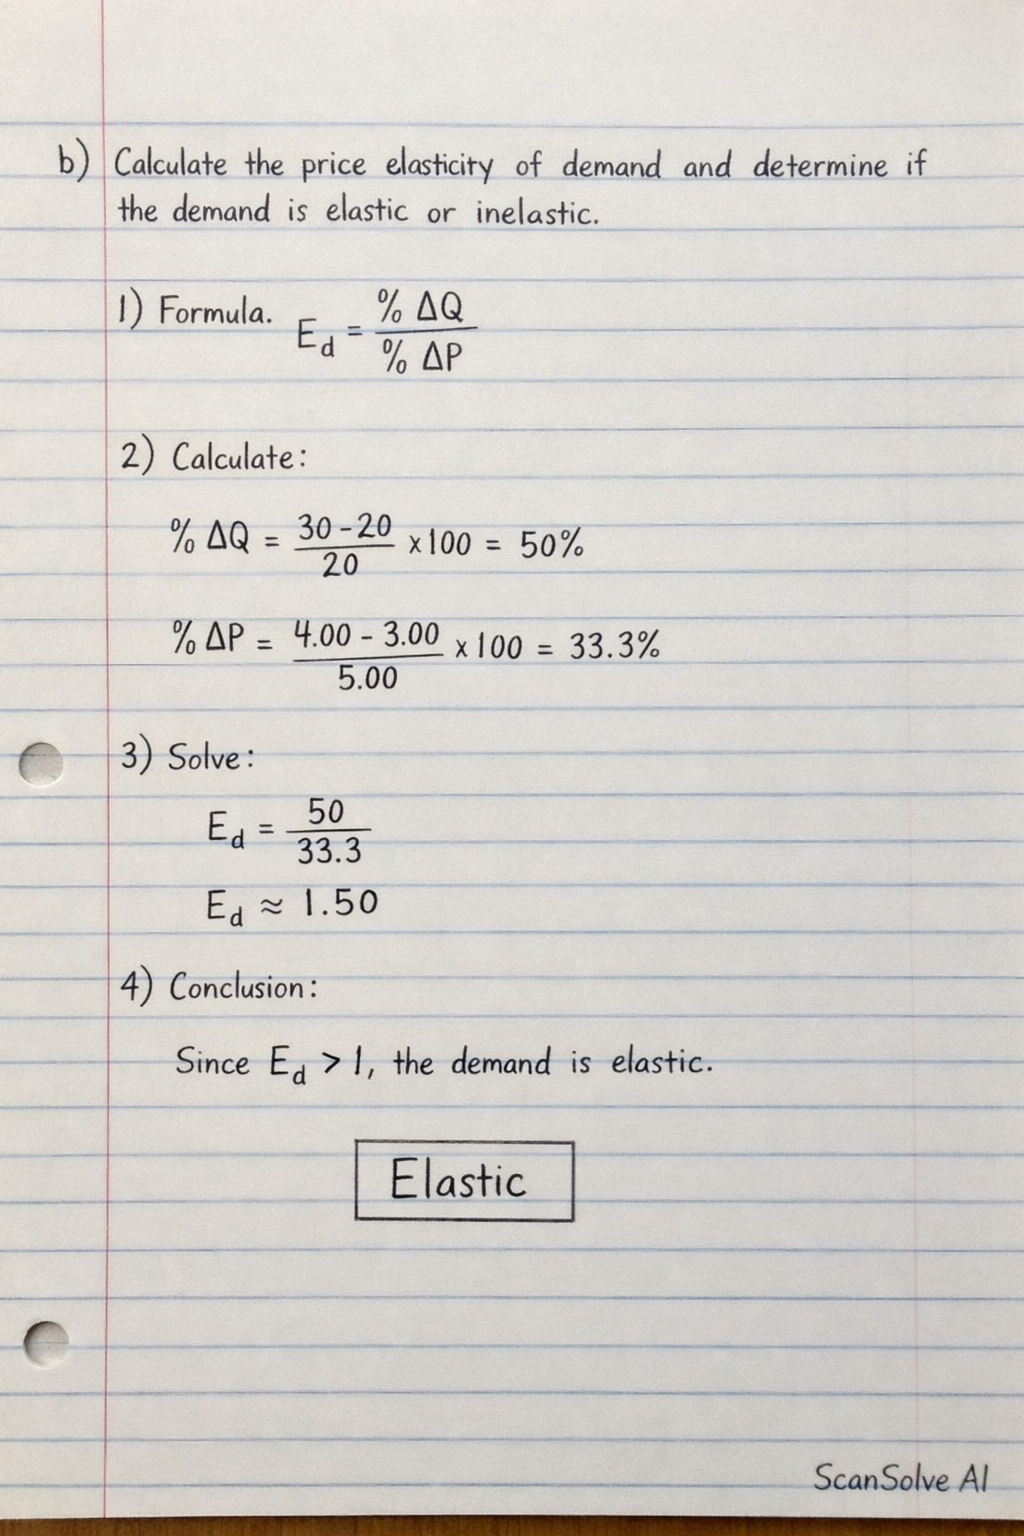
b) The effect on demand will be an increase.
Was this helpful?
Still stuck on this one?
Ask a follow-up, and the answer starts from this question.
Got a different question?Ask your own question
More Economics Questions
QIllustrate on the graph below the effect on the supply of coke when the price of pepsi increases…QExplain the diagram that shows a shift in the supply curve to the left and list four possible causes…QDraw diagrams to illustrate an increase and a decrease in the supply of cocoa beans, explaining the…QWith the aid of an appropriate diagram state and explain the law of demand.QA. With the aid of a diagram show the effect of an increase in the supply of a commodity while…
Browse by topic:Microeconomics
Handwritten Step-by-Step Solution
Get this as a handwritten image on WhatsApp — like a tutor wrote it for you.
Try on WhatsApp