
We read your photo as:
For rural urban migration in Alexandra township situated in Johannesburg south Africa
History
ScanSolve AI Answer
Here's how the principles of data collection and representation (Step 4) apply to the geographical problem of rural-urban migration in Alexandra Township:
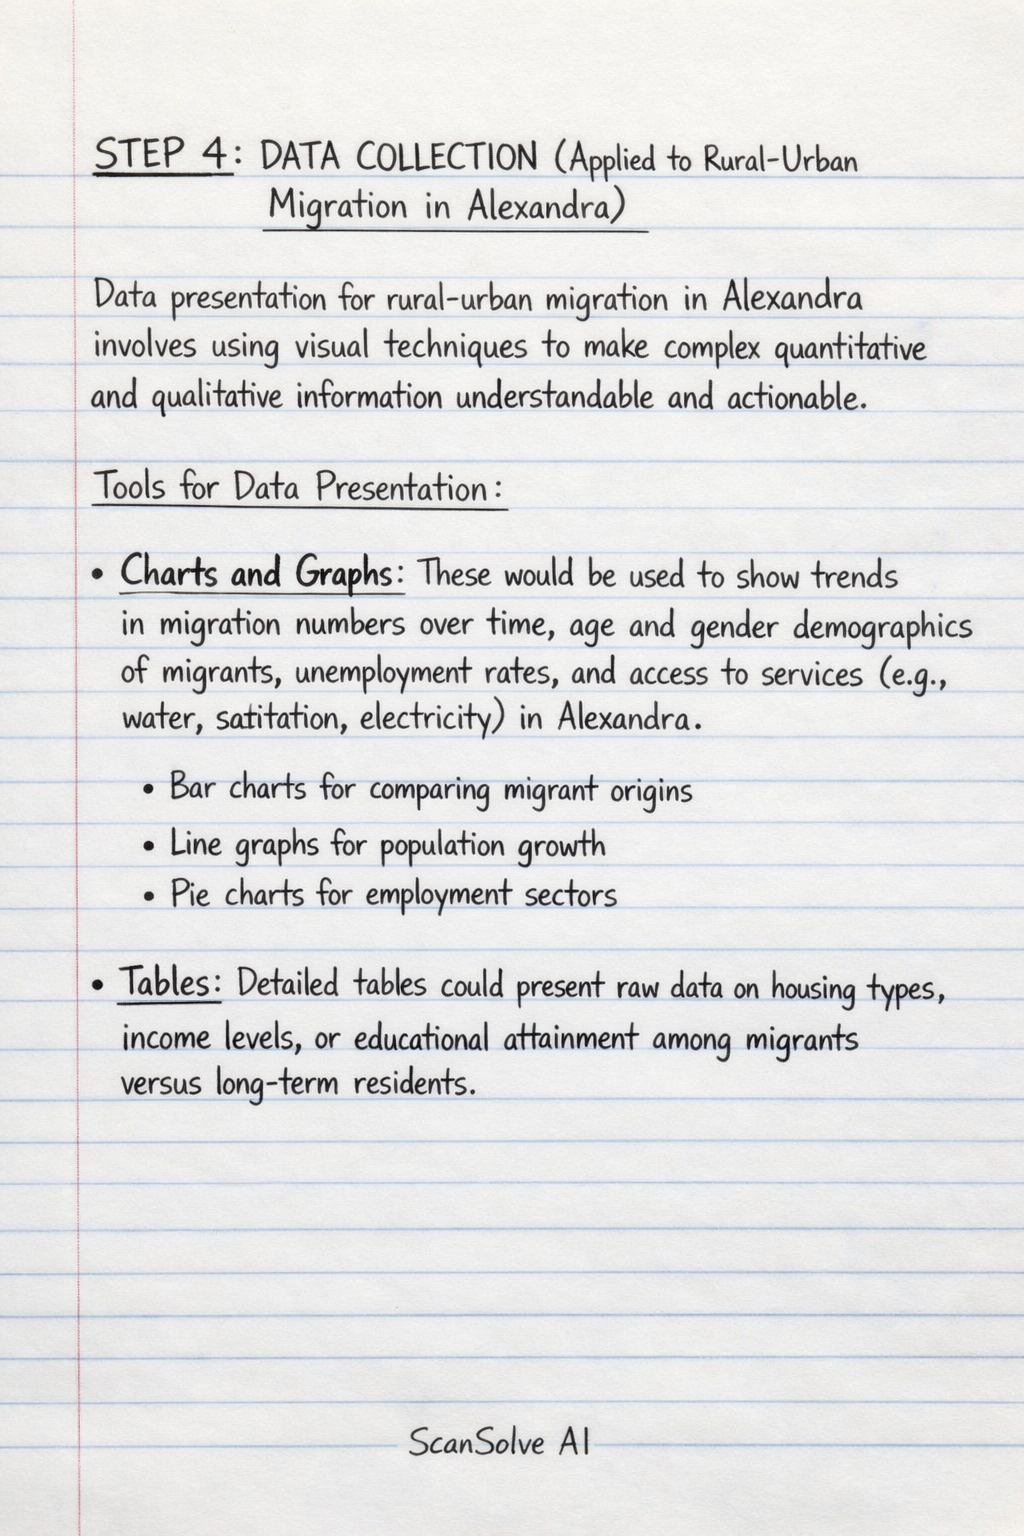
STEP 4 DATA COLLECTION (Applied to Rural-Urban Migration in Alexandra)
Data presentation for rural-urban migration in Alexandra involves using visual techniques to make complex quantitative and qualitative information understandable and actionable.
-
Tools for Data Presentation:
- Charts and Graphs: These would be used to show trends in migration numbers over time, age and gender demographics of migrants, unemployment rates, and access to services (e.g., water, sanitation, electricity) in Alexandra. Examples include bar charts for comparing migrant origins, line graphs for population growth, and pie charts for employment sectors.
- Tables: Detailed tables could present raw data on housing types, income levels, or educational attainment among migrants versus long-term residents.
- Infographics: These would combine statistics, maps, and simple visuals to explain complex relationships, such as the push and pull factors driving migration to Alexandra, or the impact of migration on infrastructure.
- Concise Explanations: Each visual representation would be accompanied by clear, brief explanations to facilitate quick comprehension and support informed decision-making by local authorities or NGOs.
-
Data Representation:
- Formulating Discussion: The collected data (e.g., on population density, informal settlements, service provision, economic activities) would be used to formulate a discussion around the existing geographical problem of rapid urbanization, resource strain, and socio-economic challenges in Alexandra due to migration.
- Graphical Representation:
- Maps: Thematic maps showing population density, distribution of informal settlements, or access to public transport within Alexandra.
- Sketches: Field sketches of typical housing conditions, informal markets, or areas affected by environmental degradation.
- Photographs: Images capturing the living conditions, infrastructure challenges, or community life in Alexandra, providing a visual context to the quantitative data.
- Analysis of Graphic Information: The graphic information (maps, sketches, photographs) must be analyzed to identify spatial patterns, visualize the extent of informal settlements, understand the environmental impacts, and assess the quality of life for migrants and residents in Alexandra. This analysis helps to corroborate quantitative data and provide deeper insights into the human geography of the township.
Was this helpful?
Still stuck on this one?
Ask a follow-up, and the answer starts from this question.
Got a different question?Ask your own question
More History Questions
QAnalysis and synthesis of data for rural urban migration in Alexandra township situated in…QIn this project, you are going to find information about a settlement. This settlement must be…QComment on the trend from 2016 to 2023 in the graph regarding people living in rural areas in South…QAnalyze the provided figure and text to determine the accuracy of the given statements regarding…QUrbanisation involves rural - urban movement. Discuss
Handwritten Step-by-Step Solution
Get this as a handwritten image on WhatsApp — like a tutor wrote it for you.
Try on WhatsApp