
We read your photo as:
A) Count and write the number of votes for each of the towns. b) Draw a histogram showing the pooling stations and the number of votes.
ScanSolve AI Answer
Step-by-step solution
5 steps4. a) Count and write the number of votes for each of the towns
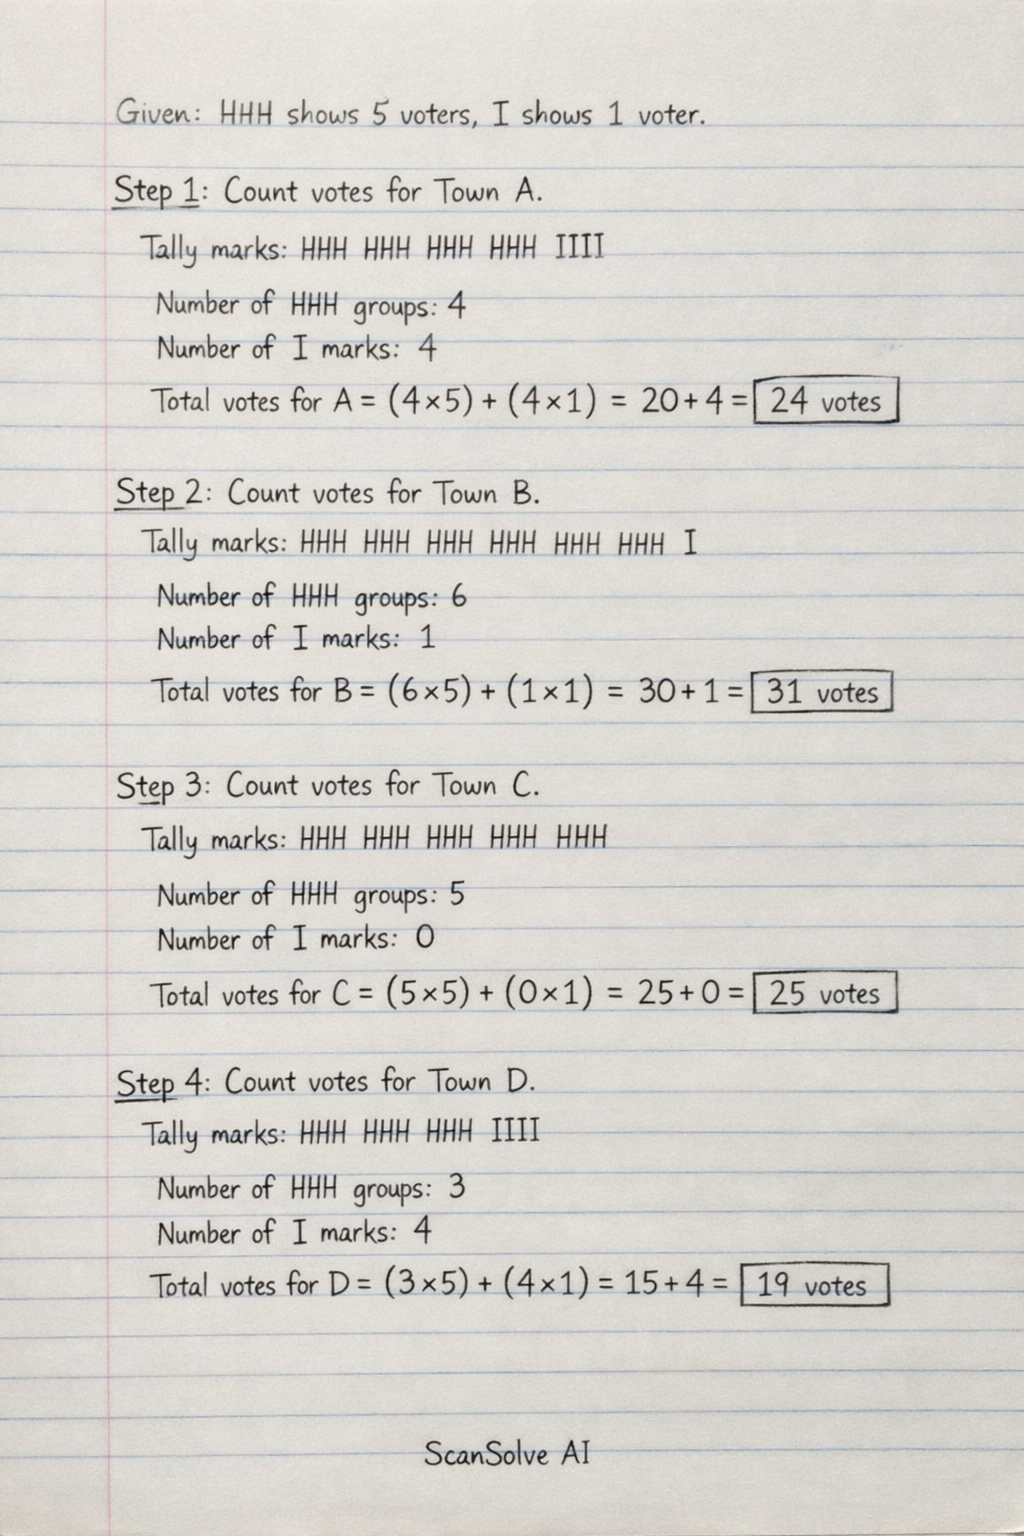
Given: HHH shows 5 voters, shows 1 voter.
Count votes for Town A.
Tally marks:
HHH HHH HHH HHH IIII
Number ofHHHgroups: 4
Number of marks: 4
Total votes for A = .
Town A:Count votes for Town B.
Tally marks:
HHH HHH HHH HHH HHH HHH I
Number ofHHHgroups: 6
Number of marks: 1
Total votes for B = .
Town B:Count votes for Town C.
Tally marks:
HHH HHH HHH HHH HHH
Number ofHHHgroups: 5
Number of marks: 0
Total votes for C = .
Town C:Count votes for Town D.
Tally marks:
HHH HHH HHH IIII
Number ofHHHgroups: 3
Number of marks: 4
Total votes for D = .
Town D:Count votes for Town E.
Tally marks:
HHH HHH HHH HHH HHH IIII
Number ofHHHgroups: 5
Number of marks: 4
Total votes for E = .
Town E:4. b) Draw a histogram showing the pooling stations and the number of votes
To draw a histogram:- Draw two axes. The horizontal axis (x-axis) will represent the Pooling Stations (Towns A, B, C, D, E). The vertical axis (y-axis) will represent the Number of Votes.
- Label the x-axis with the town names (A, B, C, D, E) at the center of each bar.
- Choose an appropriate scale for the y-axis, starting from 0. Since the highest number of votes is 31, a scale where each unit represents 2 or 5 votes would be suitable (e.g., 0, 5, 10, 15, 20, 25, 30, 35).
- For each town, draw a rectangular bar whose height corresponds to the number of votes counted in part a). The bars should be of equal width and typically touch each other in a histogram if the x-axis represents continuous data, but for categorical data like towns, they can be separated.
Here are the data points for your histogram:
- Town A: 24 votes
- Town B: 31 votes
- Town C: 25 votes
- Town D: 19 votes
- Town E: 29 votes
Still stuck on this one?
Ask a follow-up, and the answer starts from this question.
More Mathematics Questions
Handwritten Step-by-Step Solution
Get this as a handwritten image on WhatsApp — like a tutor wrote it for you.
Try on WhatsApp