
We read your photo as:
Draw a pie chart for the above information. 4. In an election, the number of votes won by five political parties A, B, C, D and E in a village
Mathematics
ScanSolve AI Answer
Step-by-step solution
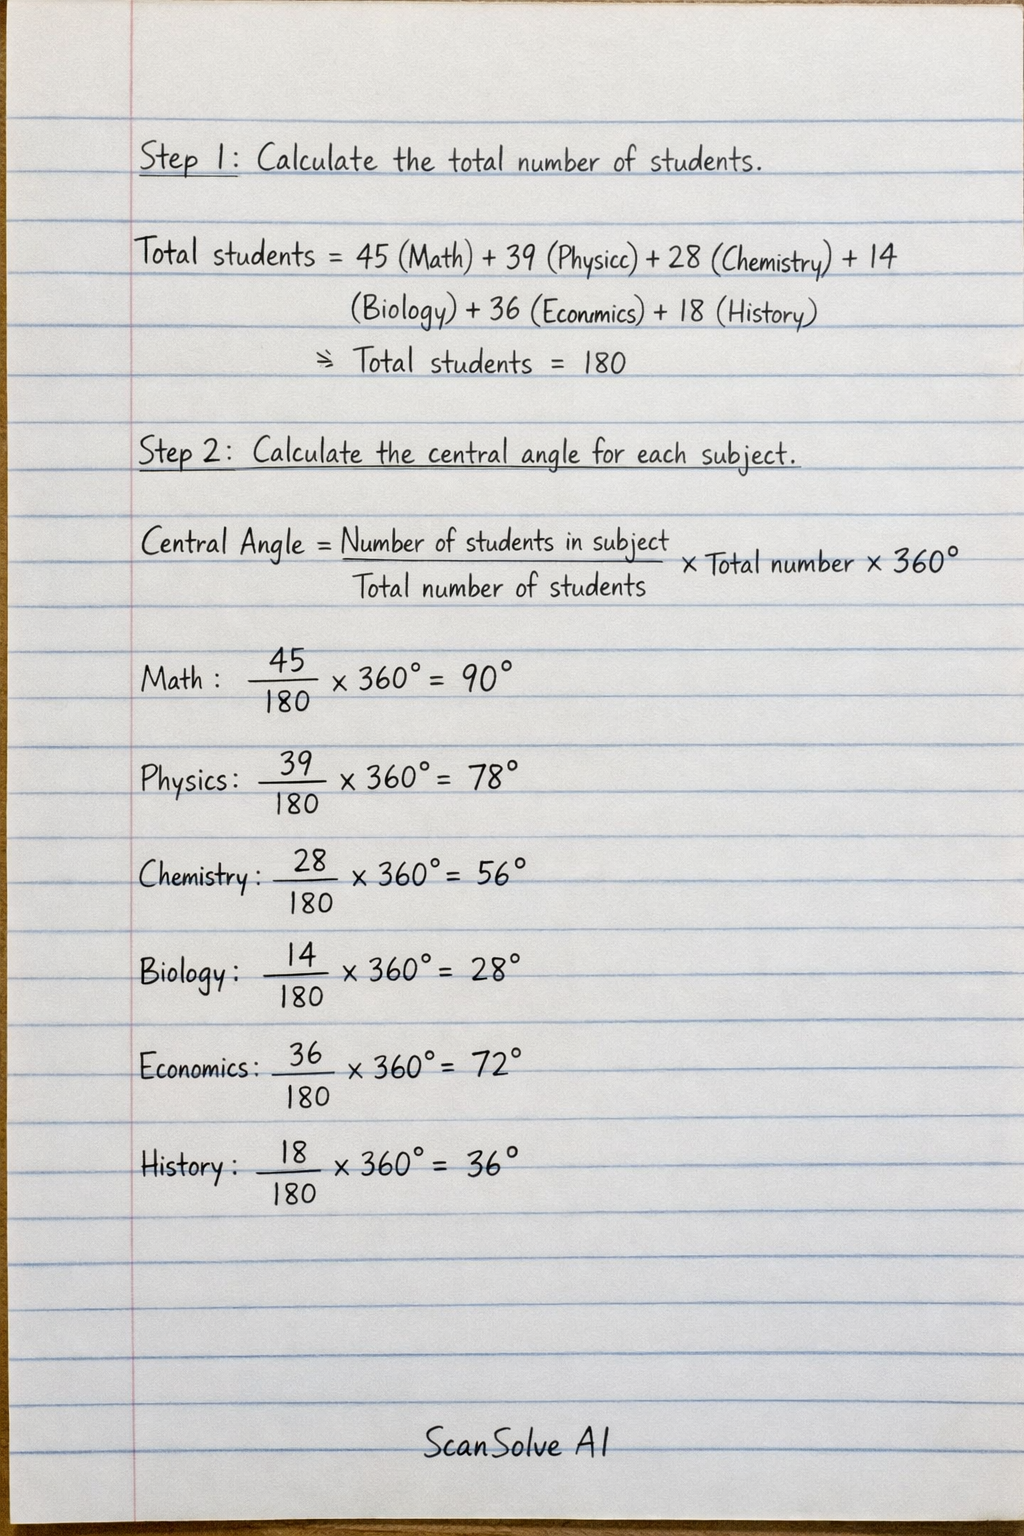
3 stepsCalculate the total number of students.
Add the number of students for all subjects:
Calculate the central angle for each subject.
To draw a pie chart, each category's proportion of the total is represented by a sector of a circle. A full circle is . The central angle for each subject is calculated as:
- Mathematics:
- Physics:
- Chemistry:
- Biology:
- Economics:
- History:
Draw the pie chart.
To draw the pie chart, use a compass to draw a circle. Then, use a protractor to measure and draw the calculated central angles from the center of the circle. Label each sector with its corresponding subject.
The central angles for the pie chart are:
- Mathematics:
- Physics:
- Chemistry:
- Biology:
- Economics:
- History:
Was this helpful?
Still stuck on this one?
Ask a follow-up, and the answer starts from this question.
Got a different question?Ask your own question
More Mathematics Questions
QDraw a pie chart to illustrate the information about votes, and calculate the percentage of votes…QA) Count and write the number of votes for each of the towns. b) Draw a histogram showing the…QDraw a pie chart representing the distribution of students across different subjects. The number of…Q5 Draw a simple bar graph to represent the information.QDraw a pie chart to indicate THREE biomes which constitute the highest percentage
Browse by topic:Statistics
Handwritten Step-by-Step Solution
Get this as a handwritten image on WhatsApp — like a tutor wrote it for you.
Try on WhatsApp