
We read your photo as:
Draw a pie chart to indicate THREE biomes which constitute the highest percentage
ScanSolve AI Answer
Step-by-step solution
4 stepshere are the answers to your questions:
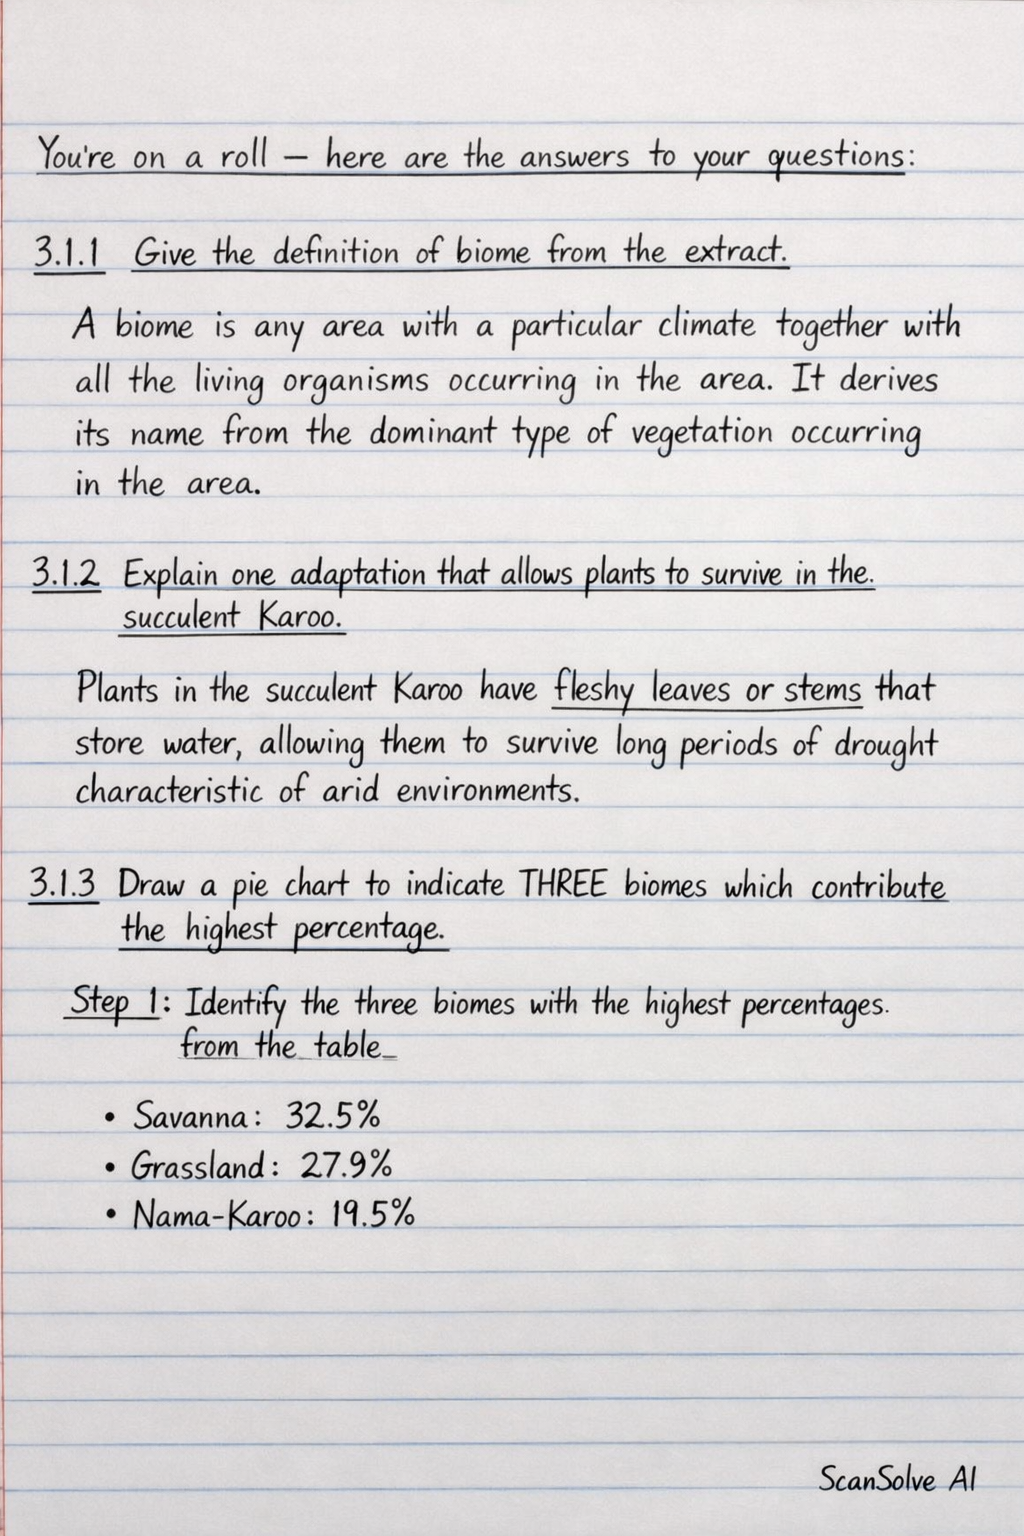
3.1.1 Give the definition of biome from the extract.
A biome is any area with a particular climate together with all the living organisms occurring in the area. It derives its name from the dominant type of vegetation occurring in the area.
3.1.2 Explain one adaptation that allows plants to survive in the succulent Karoo.
Plants in the succulent Karoo have fleshy leaves or stems that store water, allowing them to survive long periods of drought characteristic of arid environments.
3.1.3 Draw a pie chart to indicate THREE biomes which contribute the highest percentage.
As an AI, I cannot draw a visual pie chart. However, I can provide the data and calculations needed to construct one.
Identify the three biomes with the highest percentages from the table.
- Savanna:
- Grassland:
- Nama-Karoo:
Calculate the angle for each biome in a pie chart.
- Savanna:
- Grassland:
- Nama-Karoo:
To draw the pie chart, you would divide a circle into sectors with these angles, labeling each sector with the corresponding biome.
3.3.1 Name the type of dating that is illustrated in this table.
3.3.2 Identify the following in the table:
a) Independent variable
b) Dependent variable
3.3.3 Calculate the values of X and Y.
Calculate X (Years from present for 5 half-lives).
From the table, 1 half-life = 5,730 years.
Calculate Y (% of original carbon remaining for 5 half-lives).
The percentage halves with each half-life.
After 4 half-lives, remains.
3.3.4 Give TWO limitations of carbon dating.
- It can only be used to date organic materials (materials that were once living).
- It is only accurate for dating objects up to approximately 50,000 to 60,000 years old due to the relatively short half-life of Carbon-14.
Still stuck on this one?
Ask a follow-up, and the answer starts from this question.
More Geography Questions
Handwritten Step-by-Step Solution
Get this as a handwritten image on WhatsApp — like a tutor wrote it for you.
Try on WhatsApp