
We read your photo as:
A survey of 300 people on music listening preferences in 2000 and 2010 is represented by two pie charts. In 2000, 90 degrees of the pie chart represented internet listening. In 2010, 120 degrees repre
Mathematics
ScanSolve AI Answer
Answer
Step-by-step solution
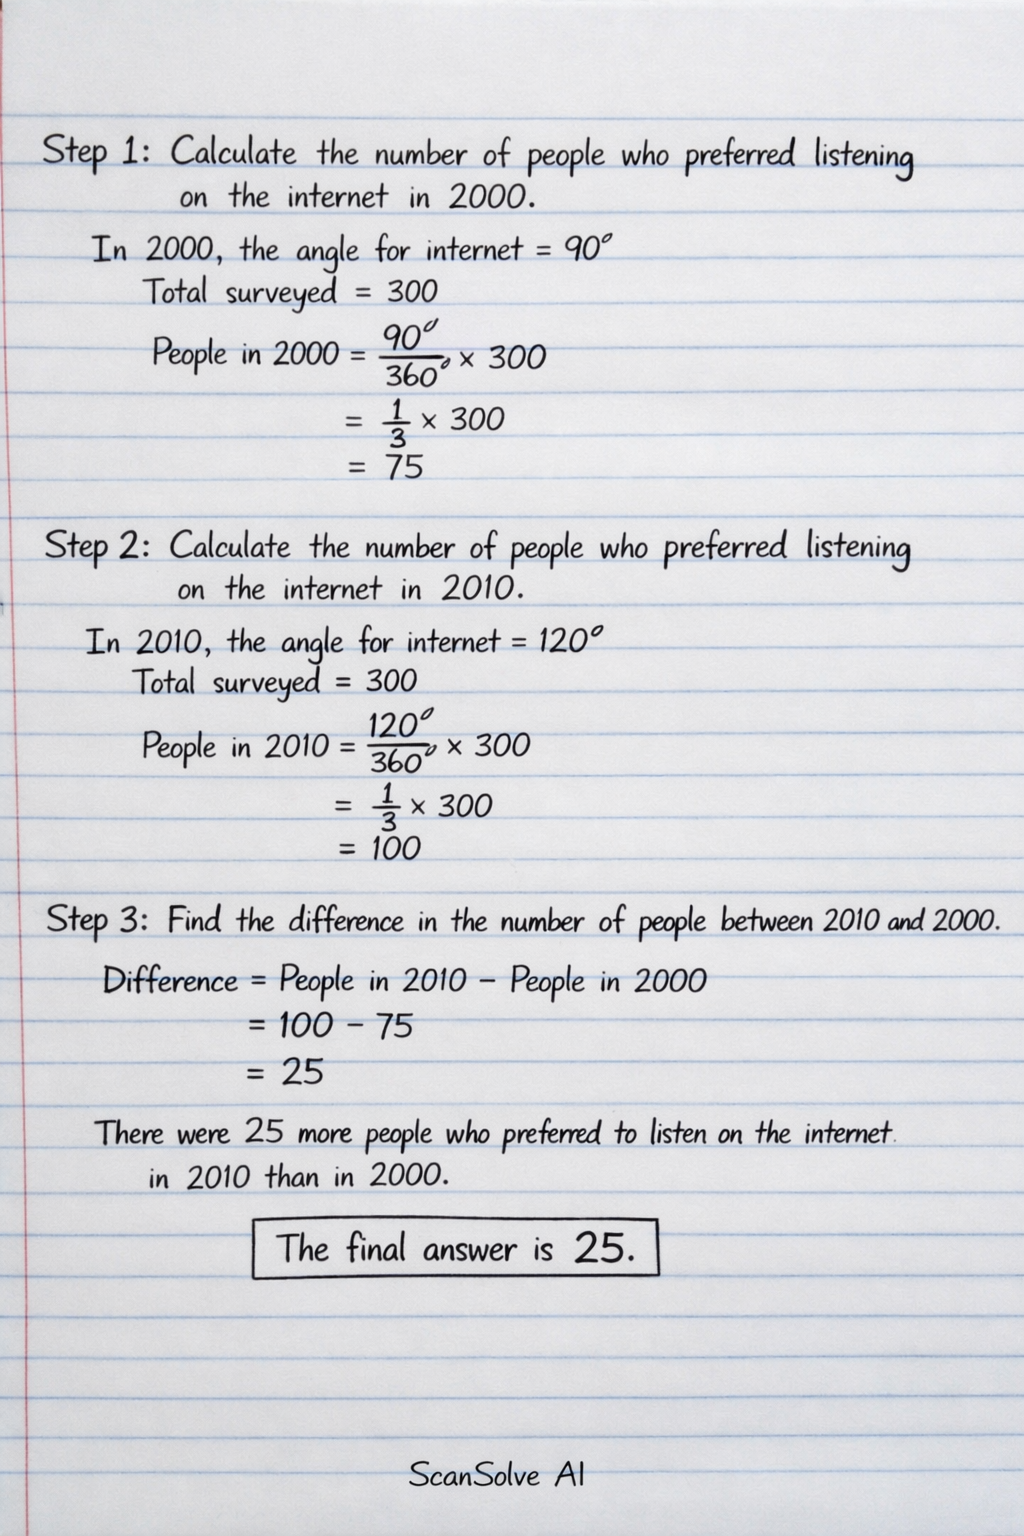
3 stepsCalculate the number of people who preferred listening on the internet in 2000.
In 2000, the angle for internet preference (purple/dotted section) is . There were 300 people surveyed.
Calculate the number of people who preferred listening on the internet in 2010.
In 2010, the angle for internet preference (purple/dotted section) is . There were 300 people surveyed.
Find the difference in the number of people between 2010 and 2000.
There were 25 more people who preferred to listen on the internet in 2010 than in 2000.
The final answer is .
Was this helpful?
Try one yourself
A new problem that tests the same skill.
Still stuck on this one?
Ask a follow-up, and the answer starts from this question.
Got a different question?Ask your own question
More Mathematics Questions
QIn 2025 sixty students were asked how they travelled to college. Pie chart A below shows the results…QA pie chart shows the hobbies of 180 pupils. Reading is 120°, Sports is 90°, Music is 60°. Calculate…QRepresent the given data about students' favorite games and languages using pie charts. Calculate…QA pie chart shows the expenditure of a household. Food expenditure is represented by angle x…QA pie chart shows a child's daily activities. Homework: 120°, School: 90°, Play: 40°, Sleep: 90°…
Browse by topic:Statistics
Handwritten Step-by-Step Solution
Get this as a handwritten image on WhatsApp — like a tutor wrote it for you.
Try on WhatsApp