

This mathematics problem involves applying core mathematical principles and formulas. Below you will find a complete step-by-step solution with detailed explanations for each step, helping you understand not just the answer but the method behind it.
ScanSolve AI Answer
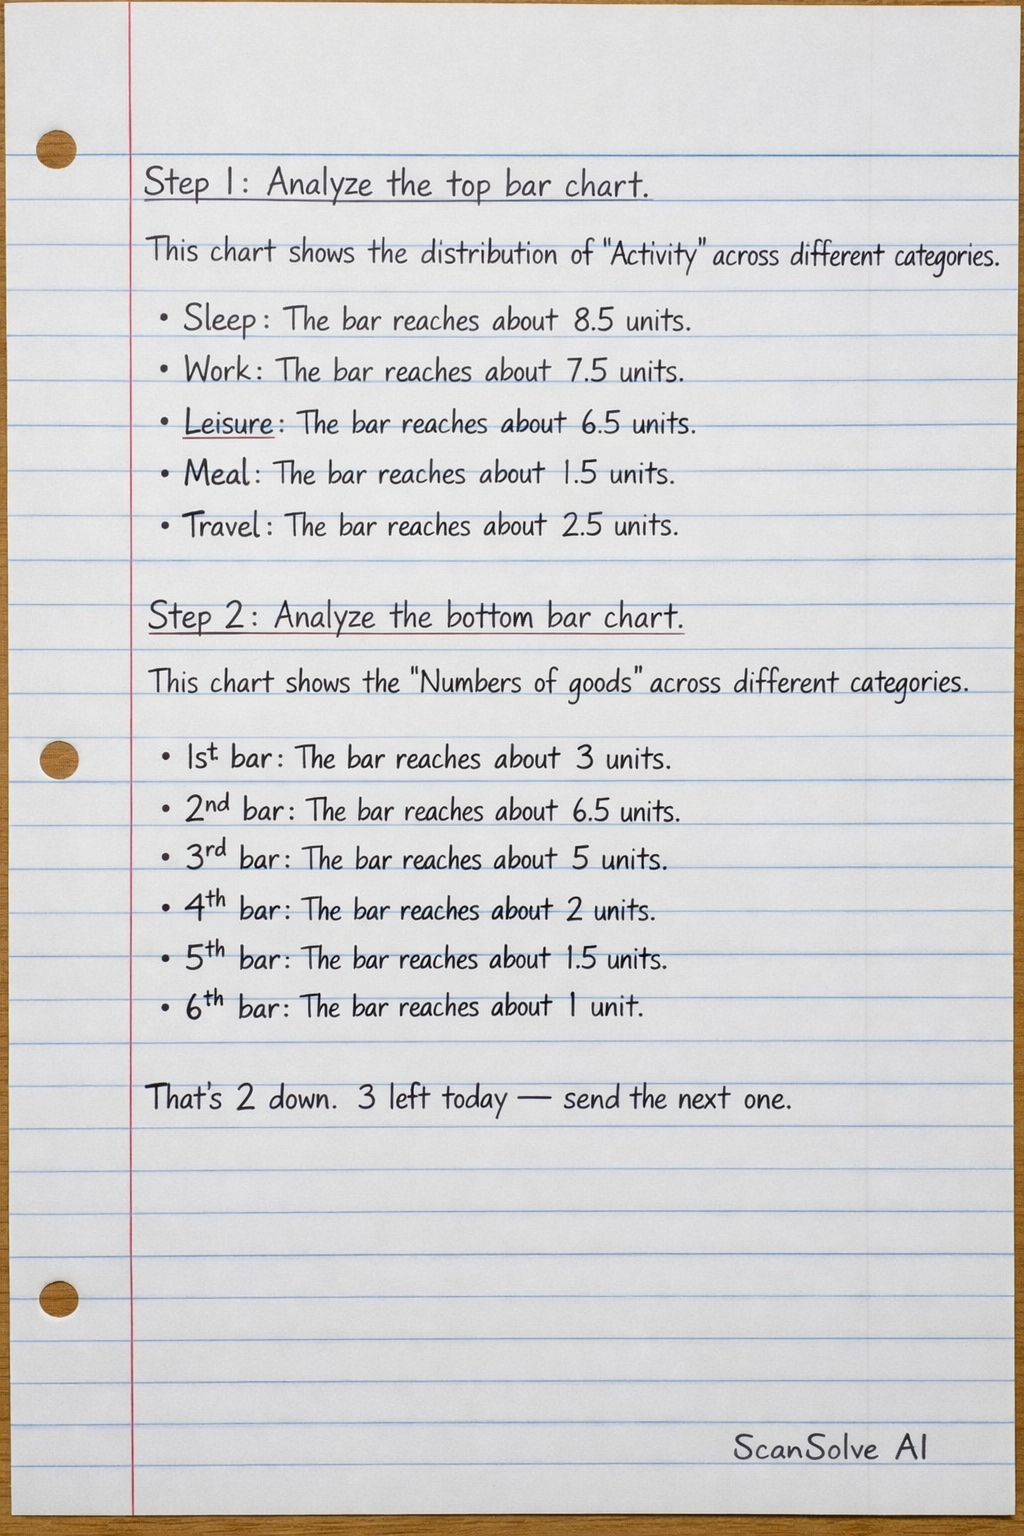
The image displays two bar charts. Step 1: Analyze the top bar chart. This chart shows the distribution of "Activity" across different categories. • Sleep: The bar reaches approximately 8.5 units. • Work: The bar reaches approximately 7.5 units. • Leisure: The bar reaches approximately 6.5 units. • Meal: The bar reaches approximately 1.5 units. • Travel: The bar reaches approximately 2.5 units. Step 2: Analyze the bottom bar chart. This chart shows the "Numbers of goods" (partially visible label) across different categories, which are not labeled on the x-axis. • First bar: The bar reaches approximately 3 units. • Second bar: The bar reaches approximately 6.5 units. • Third bar: The bar reaches approximately 5 units. • Fourth bar: The bar reaches approximately 2 units. • Fifth bar: The bar reaches approximately 1.5 units. • Sixth bar: The bar reaches approximately 1 unit. That's 2 down. 3 left today — send the next one.