
We read your photo as:
Consider the following four simples A, B, C, D. Are there significant different between the mean of the treatment of the samples on the basis of the 5% of level of significant?
ScanSolve AI Answer
Step-by-step solution
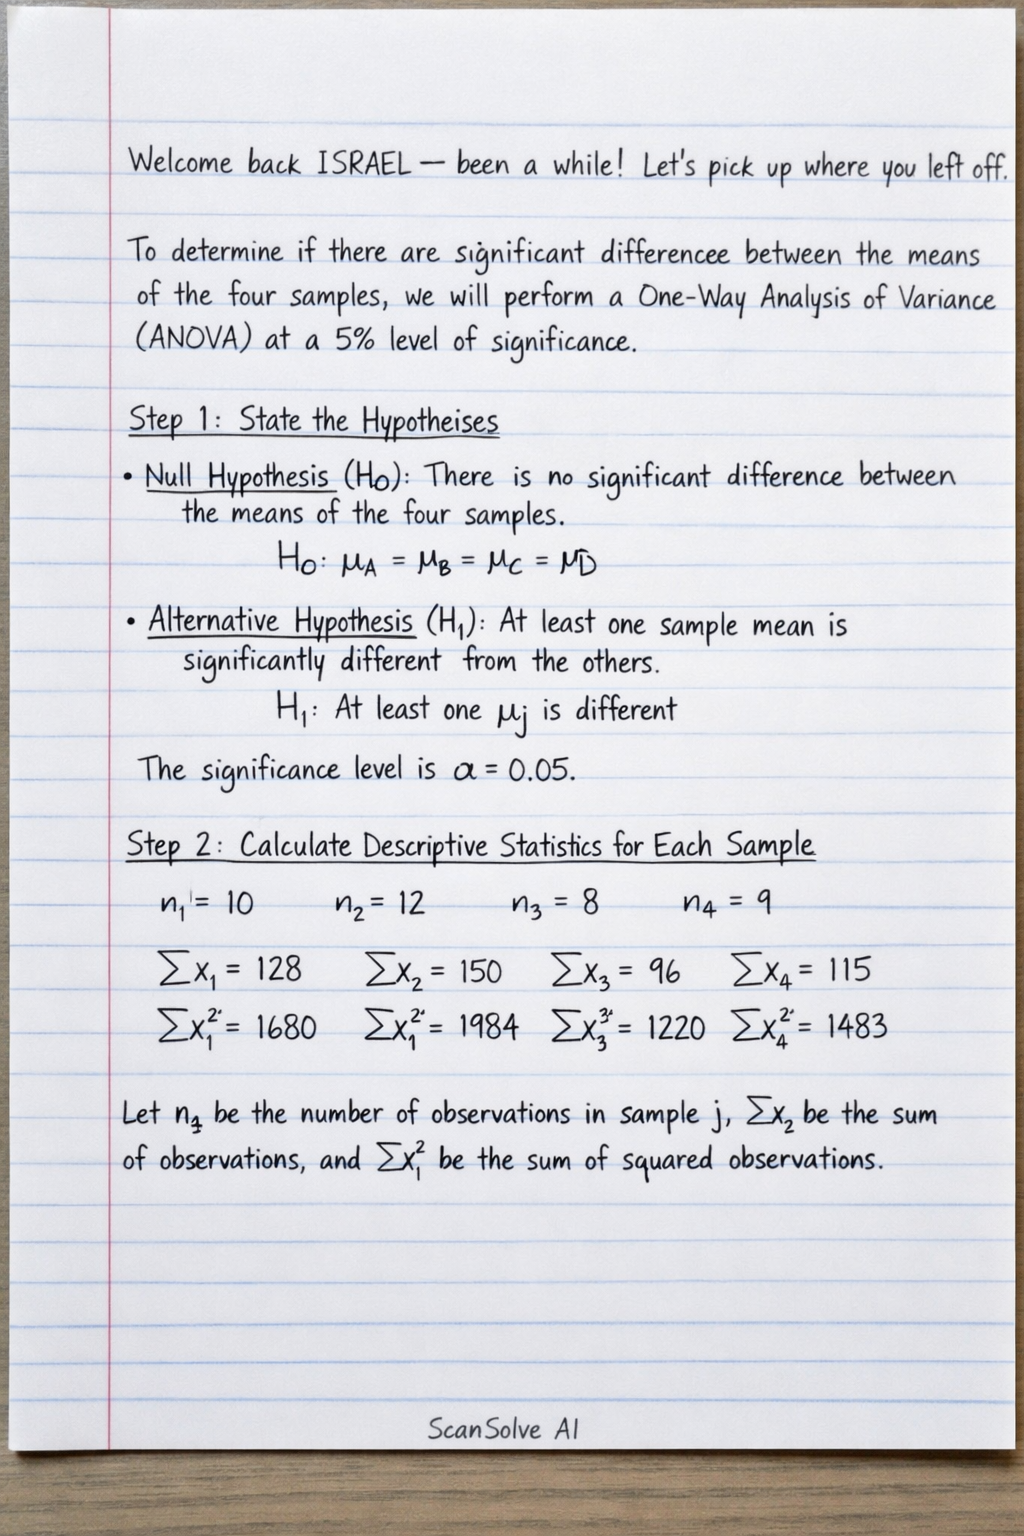
10 stepsTo determine if there are significant differences between the means of the four samples, we will perform a One-Way Analysis of Variance (ANOVA) at a 5% level of significance.
State the Hypotheses
- Null Hypothesis (): There is no significant difference between the means of the four samples.
- Alternative Hypothesis (): At least one sample mean is significantly different from the others.
The significance level is .
Calculate Descriptive Statistics for Each Sample
Let be the number of observations in sample , be the sum of observations, and be the sum of squared observations.
- Sample A:
- Sample B:
- Sample C:
- Sample D:
Calculate Overall Statistics
Total number of observations .
Grand Sum .
Grand Sum of Squares .
Correction Factor .Calculate Sum of Squares
- Sum of Squares Total (SST):
- Sum of Squares Between Treatments (SSTreatment):
- Sum of Squares Within Treatments (SSError):
Calculate Degrees of Freedom (df)
- df for Treatments ():
- df for Error ():
- df Total ():
Calculate Mean Squares (MS)
- Mean Square for Treatments (MSTreatment):
- Mean Square for Error (MSError):
Calculate the F-statistic
Determine the Critical F-value
For , , and , the critical F-value from the F-distribution table is approximately .
Make a Decision
Since the calculated F-statistic (7.8041) is greater than the critical F-value (3.127), we reject the null hypothesis ().
State the Conclusion
There is sufficient evidence to conclude that there are significant differences between the means of the treatments (samples A, B, C, D) at the 5% level of significance.
The final answer is
Still stuck on this one?
Ask a follow-up, and the answer starts from this question.
More Mathematics Questions
Handwritten Step-by-Step Solution
Get this as a handwritten image on WhatsApp — like a tutor wrote it for you.
Try on WhatsApp