
We read your photo as:
Draw graphs to represent each of the following linear inequalities: a) x > 3 b) y > -2 c) x <= -1 d) y <= 5
ScanSolve AI Answer
Step-by-step solution
8 stepsOkay, Flora, I'll describe how to draw the graphs for these linear inequalities. You'll need a coordinate plane with x and y axes for each.
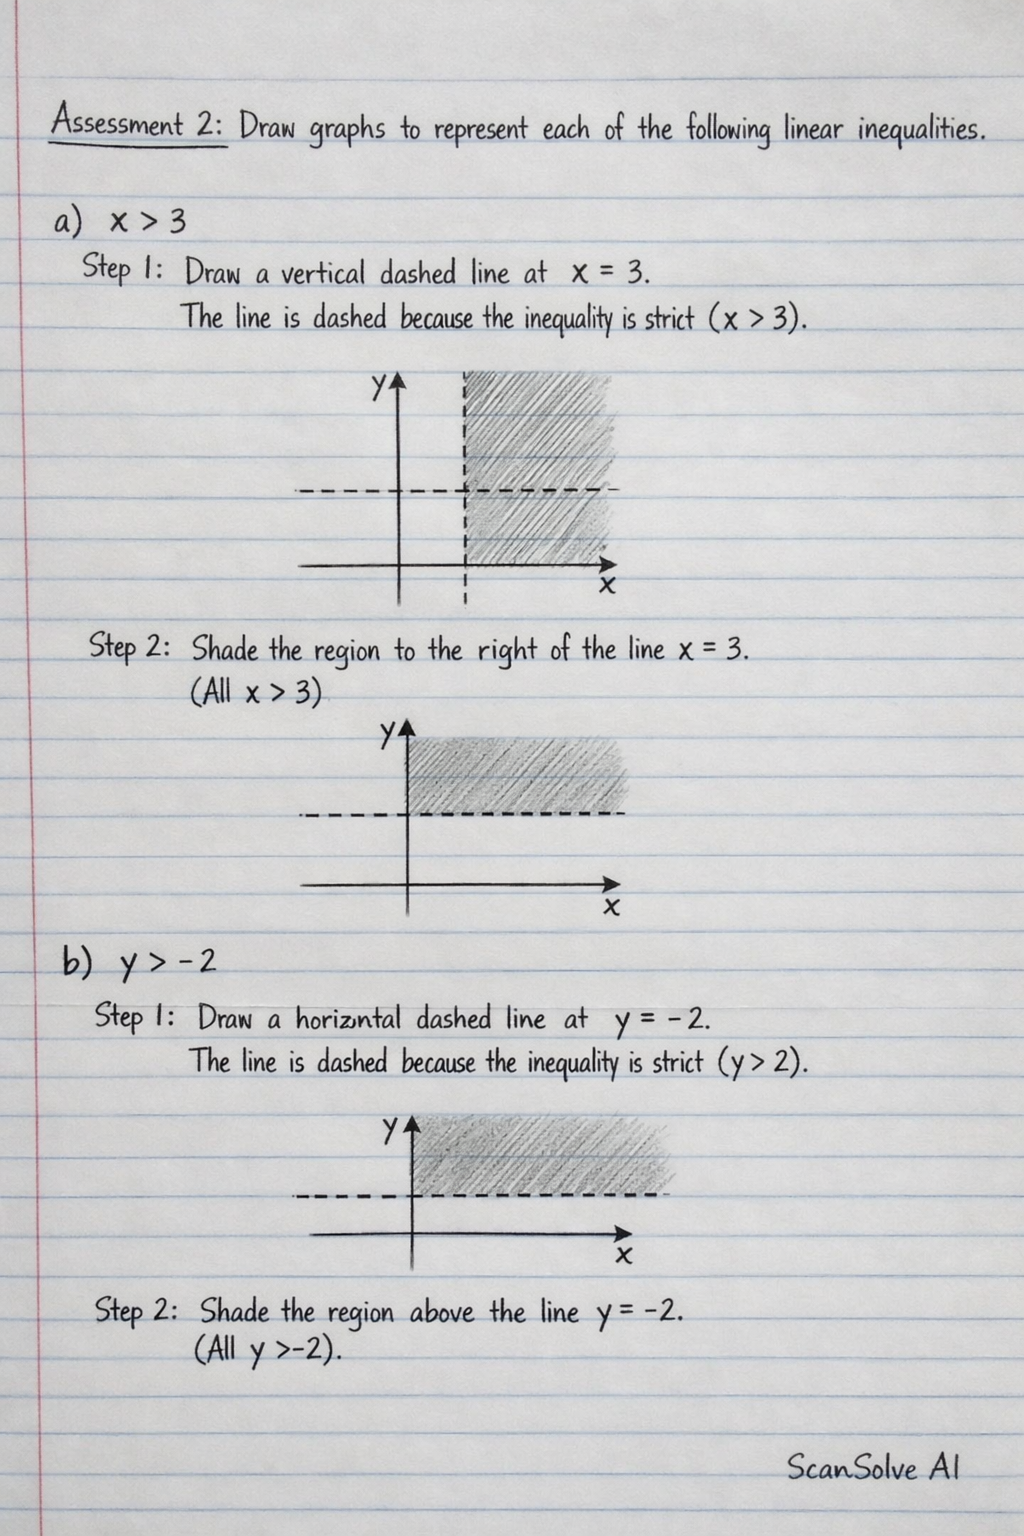
Assessment 2: Draw graphs to represent each of the following linear inequalities.
Part a· 2 steps
Draw a vertical dashed line at .
The line is dashed because the inequality is strict (), meaning is not included in the solution.
Shade the region to the right of the line .
This represents all points where the x-coordinate is greater than 3.
Part b· 2 steps
Draw a horizontal dashed line at .
The line is dashed because the inequality is strict (), meaning is not included in the solution.
Shade the region above the line .
This represents all points where the y-coordinate is greater than -2.
Part c· 2 steps
Draw a vertical solid line at .
The line is solid because the inequality includes "or equal to" (), meaning is part of the solution.
Shade the region to the left of the line .
This represents all points where the x-coordinate is less than or equal to -1.
Part d· 2 steps
Draw a horizontal solid line at .
The line is solid because the inequality includes "or equal to" (), meaning is part of the solution.
Shade the region below the line .
This represents all points where the y-coordinate is less than or equal to 5.
Still stuck on this one?
Ask a follow-up, and the answer starts from this question.
More Mathematics Questions
Handwritten Step-by-Step Solution
Get this as a handwritten image on WhatsApp — like a tutor wrote it for you.
Try on WhatsApp