
We read your photo as:
Determine the equations of the lines from the graph, representing objects' distances from Benin over time.
Mathematics
ScanSolve AI Answer
This answer stops before the end.
It was cut off when it was first written. Ask ScanSolve this question again for the full working.
Step 1: Determine the equations of the lines from the graph.
The x-axis represents time in hours, and the y-axis represents distance in km from Benin.
Line 1 (Object starting from Agbor):
This line starts at (80 km from Benin, which is Agbor).
It appears to pass through the point (2 hours, 30 km from Benin).
The slope () represents the speed of the object from Agbor.
Was this helpful?
Still stuck on this one?
Ask a follow-up, and the answer starts from this question.
Got a different question?Ask your own question
More Mathematics Questions
QI) To draw a distance-time graph, plot the time values (in minutes) on the horizontal axis (x-axis)…QDetermine the equations of the straight line and the parabola shown in the graph.QDraw a distance-time graph using the provided data points: (0,0), (15,12), (30,24), (45,36)…QFind the equation the graphs given below.QPlot the ordered pairs (x, y) for all three equations. Use a ruler to draw a solid line through the…
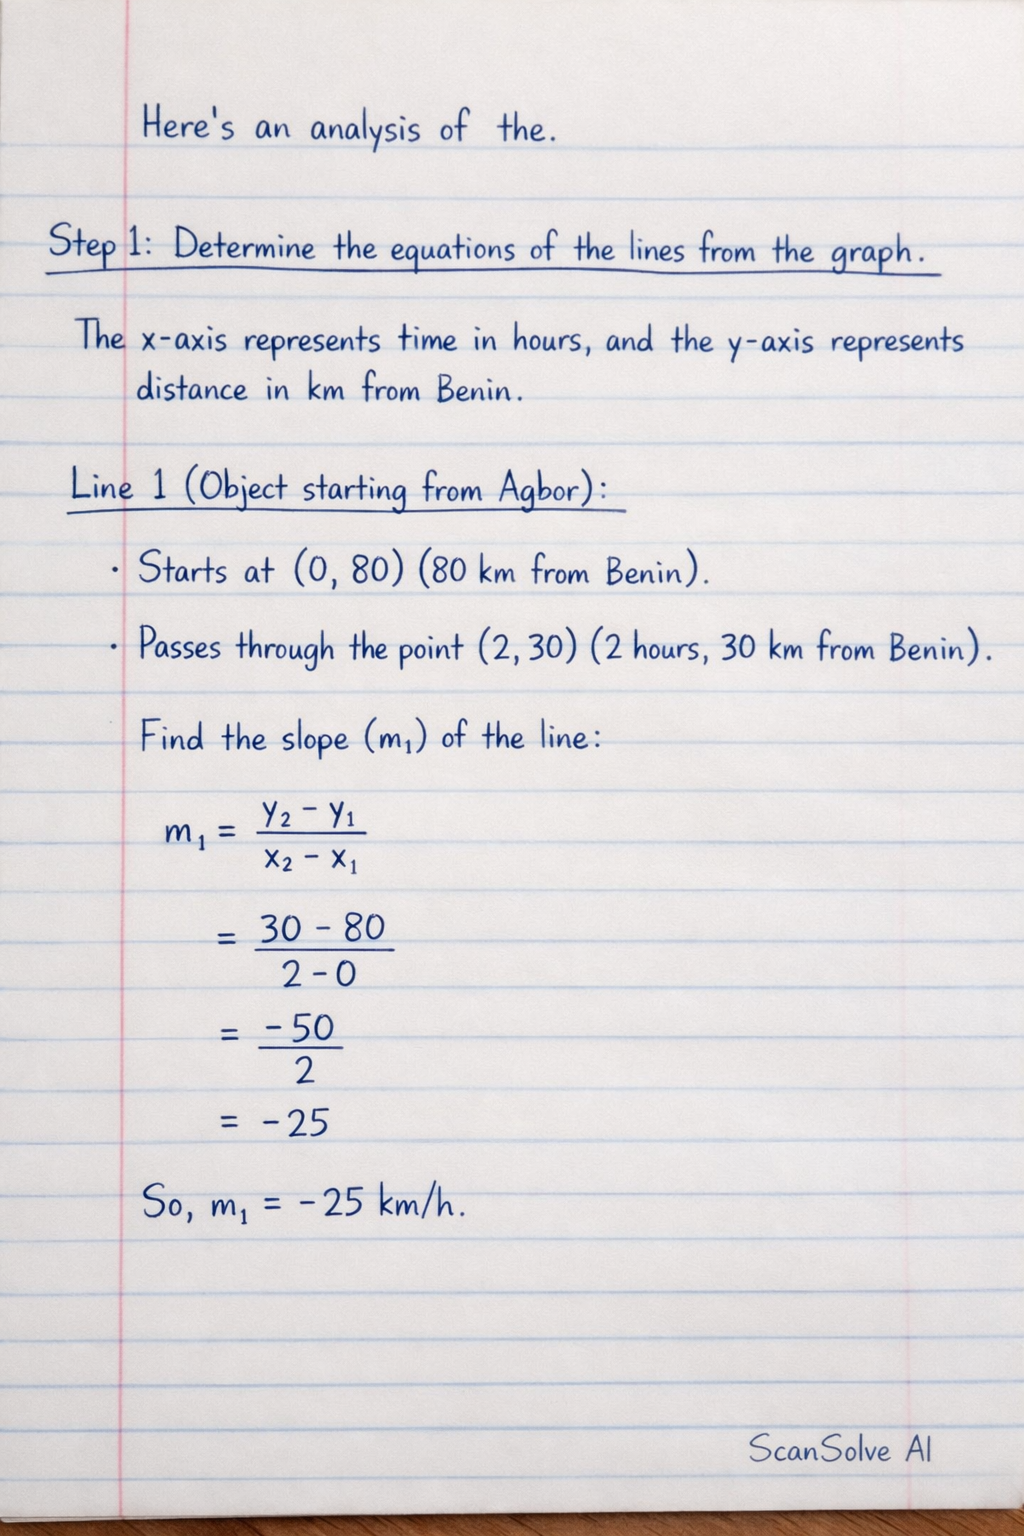
Handwritten Step-by-Step Solution
Get this as a handwritten image on WhatsApp — like a tutor wrote it for you.
Try on WhatsApp