We read your photo as:

Given the graph y = (x2 − 9)(x + 3).

Mathematics

ScanSolve AI Answer

Answers

4 parts
a

(3,0) and (−3,0)(3,0) \text{ and } (-3,0)

b
(0,-27)
c

(−3,0) and (1,−32)(-3,0) \text{ and } (1,-32)

d

(−3,0) is a maximum point while (1,−32) is a minimum point(-3,0) \text{ is a maximum point while } (1,-32) \text{ is a minimum point}

Graph of y = (x² − 9)(x + 3)

Use the left and right arrow keys to trace the curve, up and down to jump between key points, and plus and minus to zoom.

Key points of y = (x² − 9)(x + 3)
Pointxy
Maximum−30
y-intercept0−27
Minimum1−32
x-intercept30

Step-by-step solution

11 steps

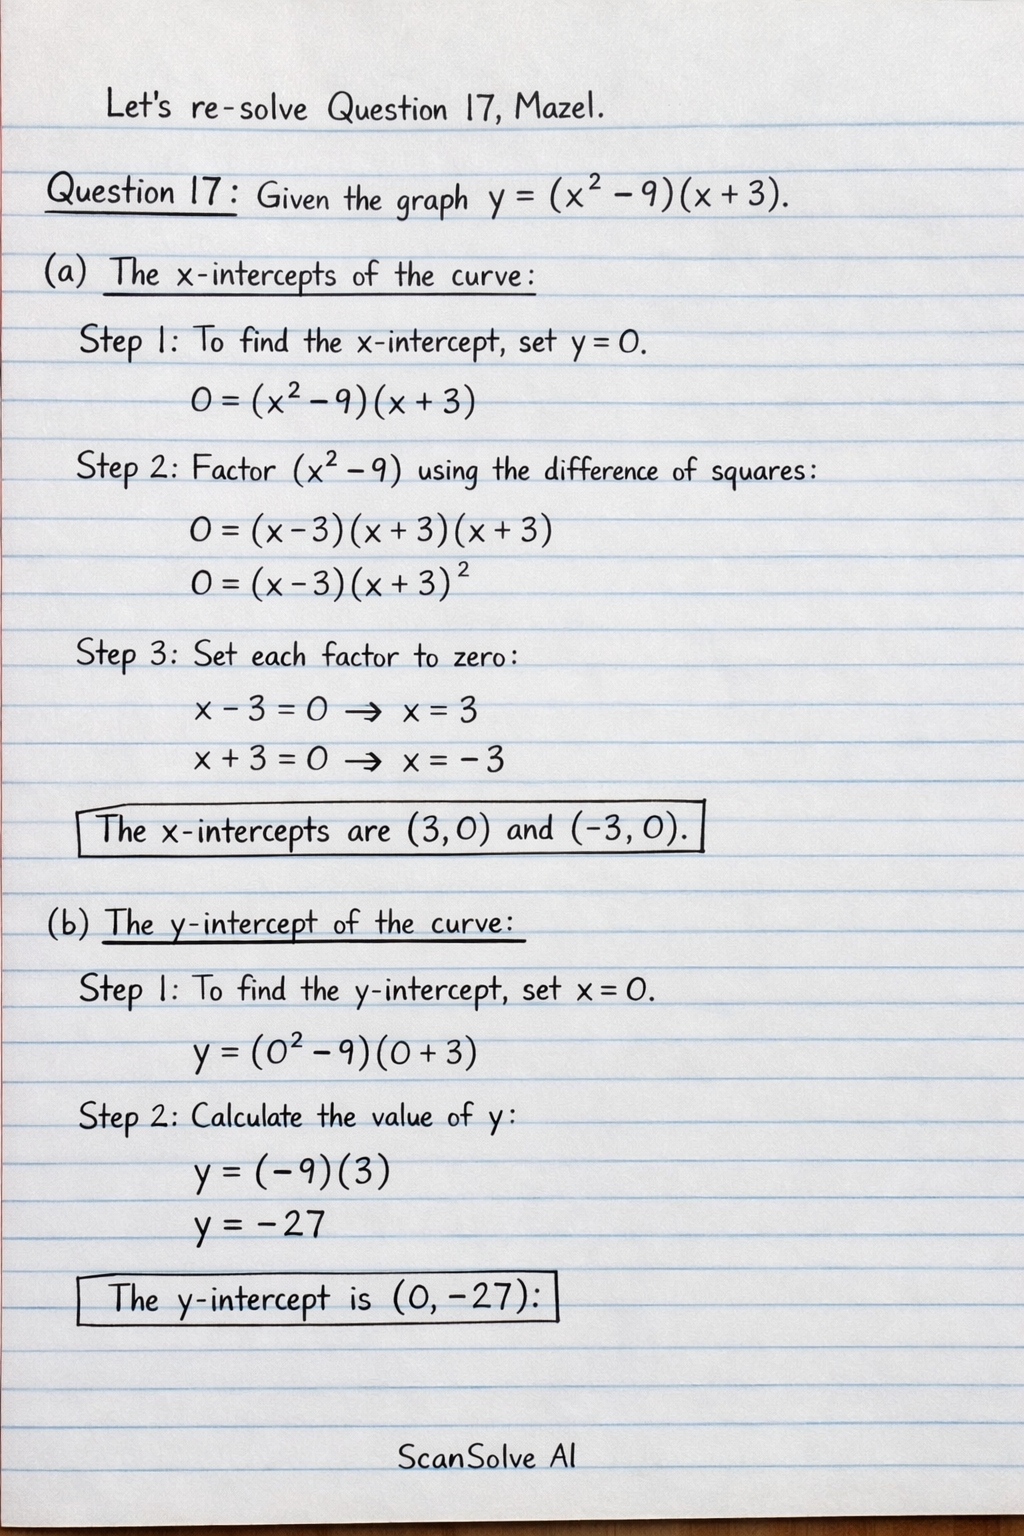
Let's re-solve Question 17, Mazel.

Part 17

Given the graph y=(x2−9)(x+3)y = (x^2 - 9)(x + 3).

Part a

(3,0) and (−3,0)(3,0) \text{ and } (-3,0)

The x-intercept of the curve

  1. To find the x-intercept, set y=0y=0.

    0=(x2−9)(x+3)0 = (x^2 - 9)(x + 3)
  2. Factor the term (x2−9)(x^2 - 9) using the difference of squares formula, a2−b2=(a−b)(a+b)a^2 - b^2 = (a-b)(a+b).

    0=(x−3)(x+3)(x+3)0 = (x-3)(x+3)(x+3) 0=(x−3)(x+3)20 = (x-3)(x+3)^2
  3. Solve for xx by setting each factor to zero.

    x−3=0  ⟹  x=3x-3 = 0 \implies x = 3 x+3=0  ⟹  x=−3x+3 = 0 \implies x = -3

    The x-intercepts are (3,0) and (−3,0)\boxed{(3,0) \text{ and } (-3,0)}.

Part b(0,-27)

The y-intercept of the curve

  1. To find the y-intercept, set x=0x=0.

    y=(02−9)(0+3)y = (0^2 - 9)(0 + 3)
  2. Calculate the value of yy.

    y=(−9)(3)y = (-9)(3) y=−27y = -27

    The y-intercept is (0,−27)\boxed{(0,-27)}.

Part c

(−3,0) and (1,−32)(-3,0) \text{ and } (1,-32)

The stationary point of the curve

  1. Expand the equation for yy.

    y=(x2−9)(x+3)y = (x^2 - 9)(x + 3) y=x3+3x2−9x−27y = x^3 + 3x^2 - 9x - 27
  2. Differentiate yy with respect to xx to find the gradient function.

    dydx=ddx(x3+3x2−9x−27)\frac{dy}{dx} = \frac{d}{dx}(x^3 + 3x^2 - 9x - 27) dydx=3x2+6x−9\frac{dy}{dx} = 3x^2 + 6x - 9
  3. Set dydx=0\frac{dy}{dx} = 0 to find the x-coordinates of the stationary points.

    3x2+6x−9=03x^2 + 6x - 9 = 0

    Divide the entire equation by 3:

    x2+2x−3=0x^2 + 2x - 3 = 0

    Factor the quadratic equation:

    (x+3)(x−1)=0(x+3)(x-1) = 0

    This gives two possible x-values:

    x+3=0  ⟹  x=−3x+3 = 0 \implies x = -3 x−1=0  ⟹  x=1x-1 = 0 \implies x = 1
  4. Substitute these x-values back into the original curve equation y=x3+3x2−9x−27y = x^3 + 3x^2 - 9x - 27 to find the corresponding y-coordinates.

    For x=−3x=-3:

    y=(−3)3+3(−3)2−9(−3)−27y = (-3)^3 + 3(-3)^2 - 9(-3) - 27 y=−27+3(9)+27−27y = -27 + 3(9) + 27 - 27 y=−27+27+27−27y = -27 + 27 + 27 - 27 y=0y = 0

    So, one stationary point is (−3,0)(-3,0).
    For x=1x=1:

    y=(1)3+3(1)2−9(1)−27y = (1)^3 + 3(1)^2 - 9(1) - 27 y=1+3−9−27y = 1 + 3 - 9 - 27 y=4−36y = 4 - 36 y=−32y = -32

    So, the other stationary point is (1,−32)(1,-32).
    The stationary points are (−3,0) and (1,−32)\boxed{(-3,0) \text{ and } (1,-32)}.

Part d

(−3,0) is a maximum point while (1,−32) is a minimum point(-3,0) \text{ is a maximum point while } (1,-32) \text{ is a minimum point}

The nature of the stationary point in c above

  1. Find the second derivative of the curve.

    d2ydx2=ddx(3x2+6x−9)\frac{d^2y}{dx^2} = \frac{d}{dx}(3x^2 + 6x - 9) d2ydx2=6x+6\frac{d^2y}{dx^2} = 6x + 6
  2. Evaluate the second derivative at each stationary point's x-coordinate.

    For x=−3x=-3:

    d2ydx2∣x=−3=6(−3)+6=−18+6=−12\frac{d^2y}{dx^2}\Big|_{x=-3} = 6(-3) + 6 = -18 + 6 = -12

    Since d2ydx2<0\frac{d^2y}{dx^2} < 0, the point (−3,0)(-3,0) is a maximum point.
    For x=1x=1:

    d2ydx2∣x=1=6(1)+6=6+6=12\frac{d^2y}{dx^2}\Big|_{x=1} = 6(1) + 6 = 6 + 6 = 12

    Since d2ydx2>0\frac{d^2y}{dx^2} > 0, the point (1,−32)(1,-32) is a minimum point.
    So, (−3,0) is a maximum point while (1,−32) is a minimum point\boxed{(-3,0) \text{ is a maximum point while } (1,-32) \text{ is a minimum point}}.

Part e

Sketch the curve.

The sketch should show the following key features:

  • X-intercepts at (3,0)(3,0) and (−3,0)(-3,0).
  • Y-intercept at (0,−27)(0,-27).
  • A local maximum point at (−3,0)(-3,0).
  • A local minimum point at (1,−32)(1,-32). The curve rises from the left, reaches a maximum at (−3,0)(-3,0), then decreases, passing through the y-intercept (0,−27)(0,-27), continues to decrease to the minimum point at (1,−32)(1,-32), and then increases to the right, passing through the x-intercept (3,0)(3,0). The provided image shows a correct sketch of the curve.
Was this helpful?

Try one yourself

A new problem that tests the same skill.

Still stuck on this one?

Ask a follow-up, and the answer starts from this question.

Got a different question?Ask your own question
Handwritten step-by-step solution preview

Handwritten Step-by-Step Solution

Get this as a handwritten image on WhatsApp — like a tutor wrote it for you.

Try on WhatsApp