
This mathematics problem involves applying core mathematical principles and formulas. Below you will find a complete step-by-step solution with detailed explanations for each step, helping you understand not just the answer but the method behind it.
ScanSolve AI Answer
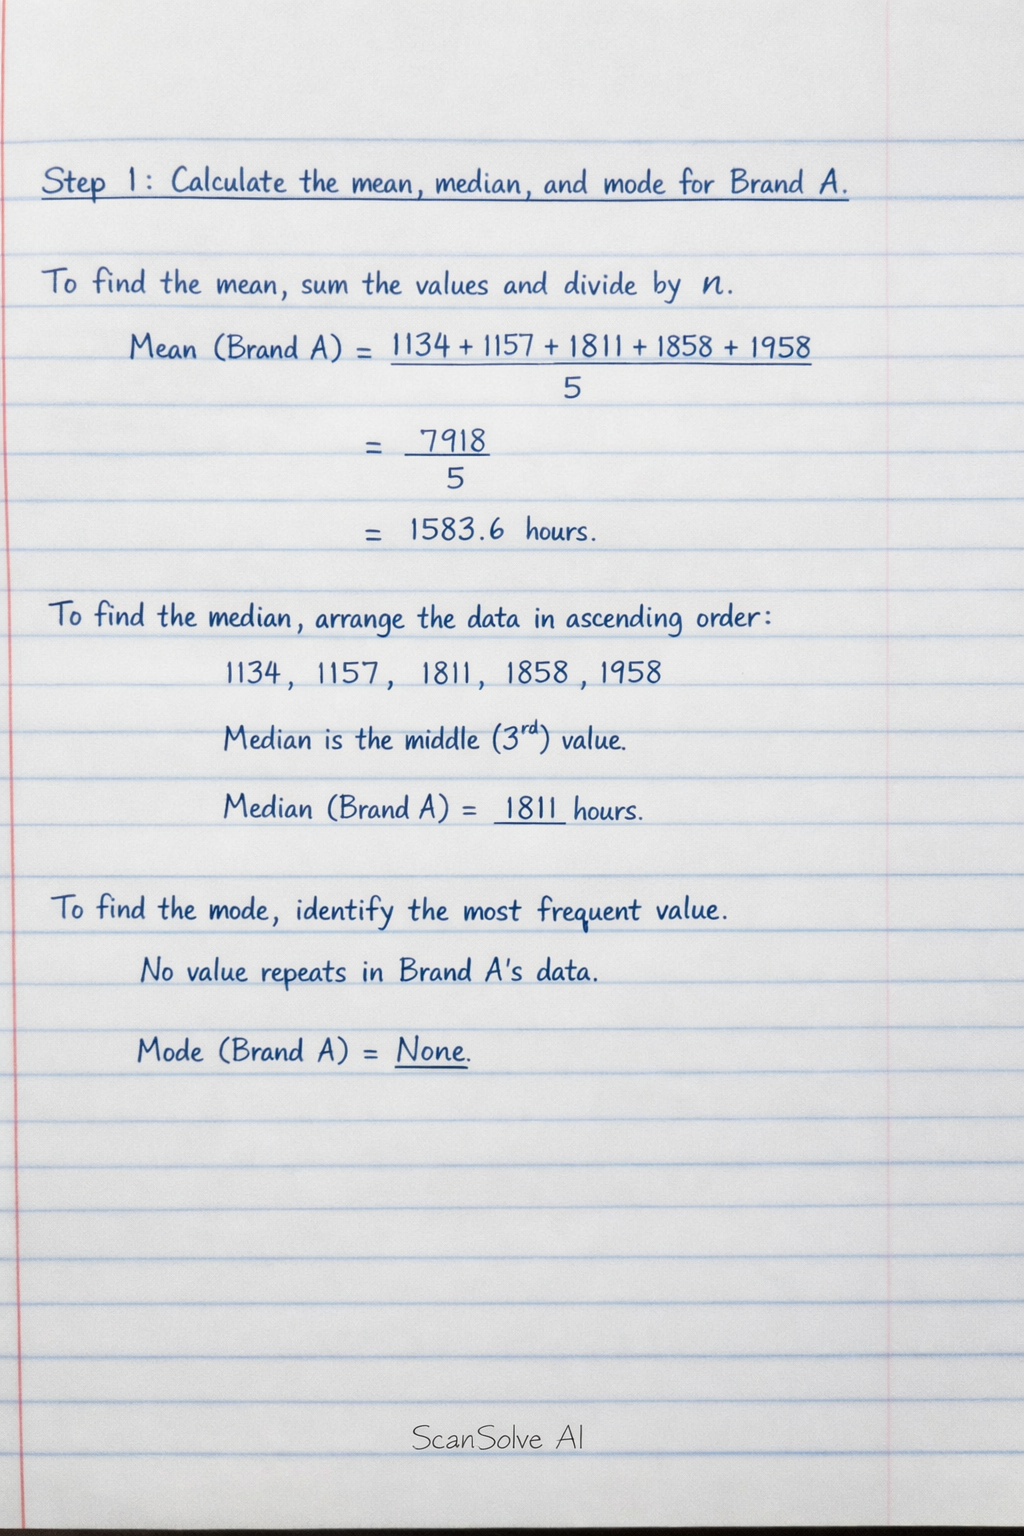
You're on a roll — let's analyze the bulb data. Brand A Data: 1134, 1157, 1811, 1858, 1958 Brand B Data: 1456, 1787, 1611, 1872, 1853 For both brands, the number of data points is n=5. Step 1: Calculate the mean, median, and mode for Brand A. To find the mean, sum the values and divide by n. Mean (Brand A) = (1134 + 1157 + 1811 + 1858 + 1958)/(5) = (7918)/(5) = 1583.6 hours To find the median, arrange the data in ascending order: 1134, 1157, 1811, 1858, 1958. Since there are 5 values, the median is the middle (3^rd) value. Median (Brand A) = 1811 hours To find the mode, identify the most frequent value. No value repeats in Brand A's data. Mode (Brand A) = None Step 2: Calculate the mean, median, and mode for Brand B. To find the mean, sum the values and divide by n. Mean (Brand B) = (1456 + 1787 + 1611 + 1872 + 1853)/(5) = (8579)/(5) = 1715.8 hours To find the median, arrange the data in ascending order: 1456, 1611, 1787, 1853, 1872. Since there are 5 values, the median is the middle (3^rd) value. Median (Brand B) = 1787 hours To find the mode, identify the most frequent value. No value repeats in Brand B's data. Mode (Brand B) = None Step 3: Calculate the standard deviation and coefficient of variation for Brand A. The formula for sample standard deviation is s = sqrt( (x_i - x))^2n-1. The sum of squared differences from the mean for Brand A is: (1134 - 1583.6)^2 + (1157 - 1583.6)^2 + (1811 - 1583.6)^2 + (1858 - 1583.6)^2 + (1958 - 1583.6)^2 = (-449.6)^2 + (-426.6)^2 + (227.4)^2 + (274.4)^2 + (374.4)^2 = 202140.16 + 182087.56 + 51711.76 + 75295.36 + 140175.36 = 651410.2 Standard Deviation (Brand A) = sqrt((651410.2)/(5-1)) = sqrt((651410.2)/(4)) = sqrt(162852.55) ≈ 403.55 hours The coefficient of variation (CV) is CV = (s)/(x) × 100\%. CV (Brand A) = (403.55)/(1583.6) × 100\% ≈ 0.2548 × 100\% ≈ 25.48\% Step 4: Calculate the standard deviation and coefficient of variation for Brand B. The sum of squared differences from the mean for Brand B is: (1456 - 1715.8)^2 + (1787 - 1715.8)^2 + (1611 - 1715.8)^2 + (1872 - 1715.8)^2 + (1853 - 1715.8)^2 = (-259.8)^2 + (71.2)^2 + (-104.8)^2 + (156.2)^2 + (137.2)^2 = 67496.04 + 5069.44 + 10983.04 + 24398.44 + 18824.64 = 126771.6 Standard Deviation (Brand B) = sqrt((126771.6)/(5-1)) = sqrt((126771.6)/(4)) = sqrt(31692.9) ≈ 177.99 hours CV (Brand B) = (177.99)/(1715.8) × 100\% ≈ 0.1037 × 100\% ≈ 10.37\% Step 5: Determine which brand is better. A better brand of bulb would have a longer average lifespan and more consistent performance (lower variability). • Mean Lifespan: Brand A (1583.6 hours) vs. Brand B (1715.8 hours). Brand B has a higher average lifespan. • Consistency (CV): Brand A (25.48\%) vs. Brand B (10.37\%). Brand B has a lower coefficient of variation, indicating more consistent performance. Based on both a higher average lifespan and greater consistency, Brand B is better. Here are the results: Brand A: • Mean: 1583.6 hours • Median: 1811 hours • Mode: None • Standard Deviation: 403.55 hours • Coefficient of Variation: 25.48\% Brand B: • Mean: 1715.8 hours • Median: 1787 hours • Mode: None • Standard Deviation: 177.99 hours • Coefficient of Variation: 10.37\% Which brand is better? Brand B What's next?