
This mathematics problem involves applying core mathematical principles and formulas. Below you will find a complete step-by-step solution with detailed explanations for each step, helping you understand not just the answer but the method behind it.
ScanSolve AI Answer
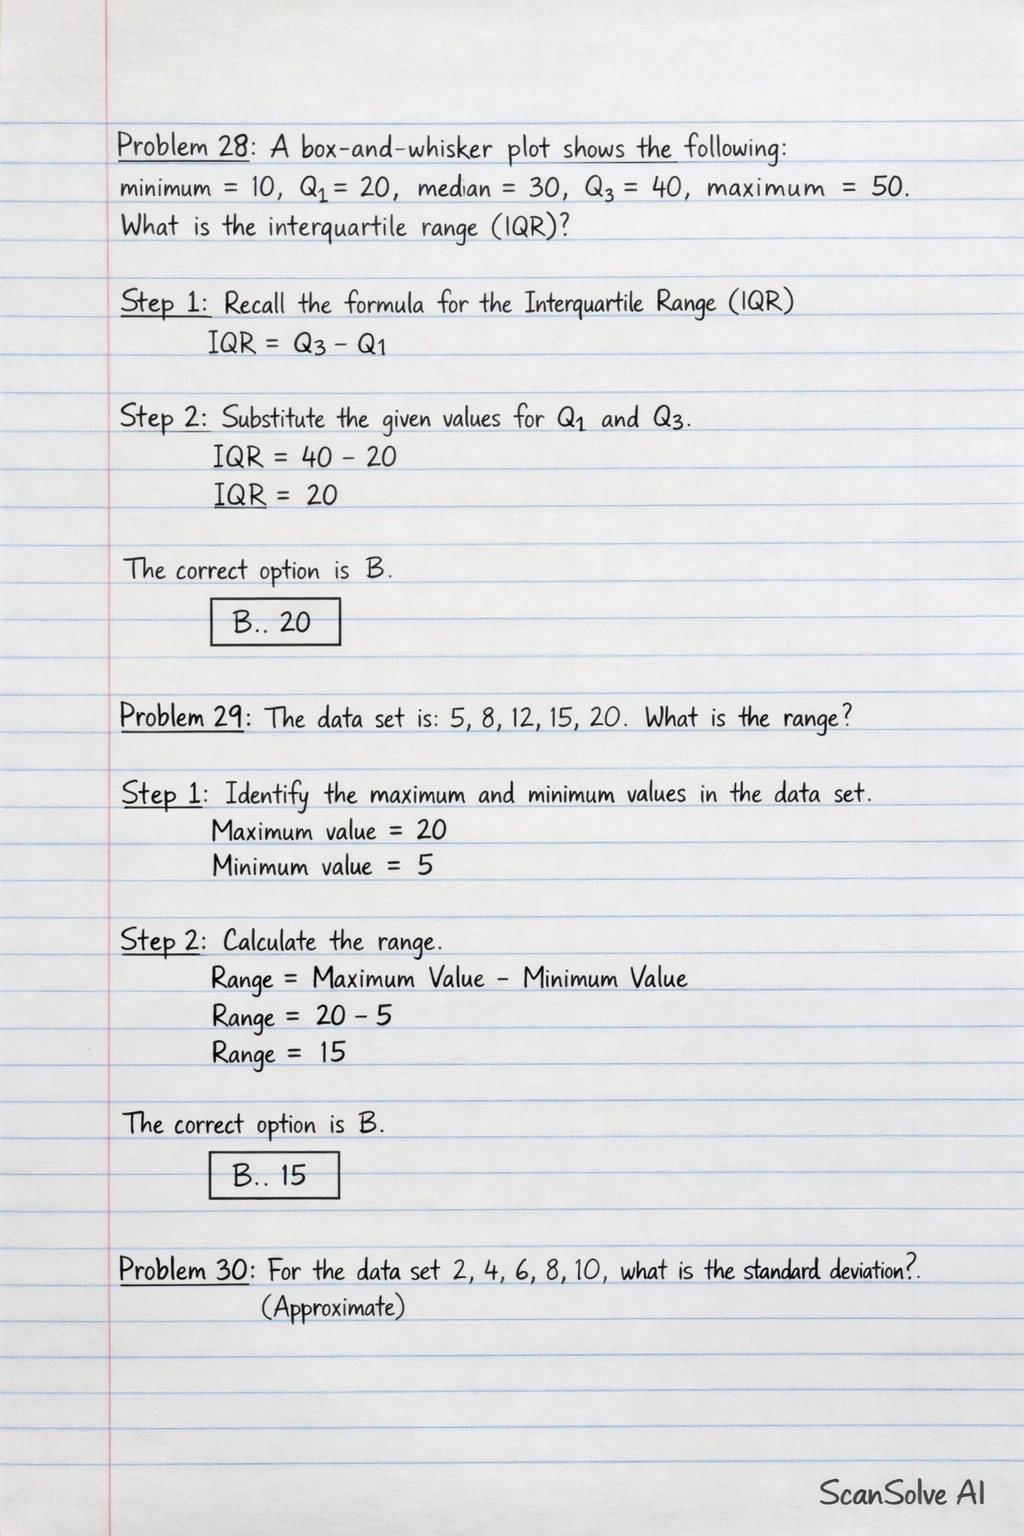
Problem 28: A box-and-whisker plot shows the following: minimum = 10, Q1 = 20, median = 30, Q3 = 40, maximum = 50. What is the interquartile range (IQR)? Step 1: Recall the formula for the Interquartile Range (IQR). IQR = Q_3 - Q_1 Step 2: Substitute the given values for Q1 and Q3. IQR = 40 - 20 IQR = 20 The correct option is B. B. 20 Problem 29: The data set is: 5, 8, 12, 15, 20. What is the range? Step 1: Identify the maximum and minimum values in the data set. Maximum value = 20 Minimum value = 5 Step 2: Calculate the range. Range = Maximum Value - Minimum Value Range = 20 - 5 Range = 15 The correct option is B. B. 15 Problem 30: For the data set 2, 4, 6, 8, 10, what is the standard deviation? (Approximate) Step 1: Calculate the mean () of the data set. = (2 + 4 + 6 + 8 + 10)/(5) = (30)/(5) = 6 Step 2: Calculate the variance (^2). ^2 = ( (x_i - )^2)/(n) ^2 = ((2-6)^2 + (4-6)^2 + (6-6)^2 + (8-6)^2 + (10-6)^2)/(5) ^2 = ((-4)^2 + (-2)^2 + (0)^2 + (2)^2 + (4)^2)/(5) ^2 = (16 + 4 + 0 + 4 + 16)/(5) ^2 = (40)/(5) = 8 Step 3: Calculate the standard deviation (). = sqrt(^2) = sqrt(8) ≈ 2.828 Rounding to two decimal places, ≈ 2.83. The correct option is A. A. 2.83 Problem 31: The variance of a data set is 16. What is the standard deviation? Step 1: Recall the relationship between variance and standard deviation. Standard deviation () is the square root of the variance (^2). = sqrt(^2) Step 2: Substitute the given variance. = sqrt(16) = 4 The correct option is B. B. 4 Problem 32: Which measure of dispersion is most affected by outliers? Step 1: Consider how each measure of dispersion is calculated. • Range: Calculated as Maximum - Minimum. Since it uses only the extreme values, it is highly sensitive to outliers. • Interquartile range (IQR): Calculated as Q3 - Q1. It focuses on the middle 50% of the data, making it resistant to outliers. • Variance: Involves squaring the differences from the mean. Outliers, being far from the mean, will have large squared differences, significantly increasing the variance. • Standard deviation: The square root of the variance, so it is also heavily influenced by outliers. The Range is the most affected by outliers because it relies solely on the two most extreme values in the data set. The correct option is A. A. Range What's next? Send 'em!